The converged communications industry is undergoing significant change. It has been well reported that fixed wireless access has captured most of the broadband industry’s growth, followed by fiber, with cable not adding customers, while DSL gets rapidly replaced. Recon Analytics’ research also shows that a substantial number of fixed wireless access subscribers did not have dedicated home internet access before; hence, it is not a zero-sum game.
Adjustments are common in the wireless industry. An operator buys another operator, customers switch from prepaid to postpaid or vice-versa, new rules on what it takes to continue to be a customer get implemented – essentially, a cleanup of the subscriber base. These changes are typically in the low hundreds of thousands, important but not earthshattering. With the shutdown of 3G networks, we are entering another period where these changes are significant. No matter what we call these disconnections and whether they are included in the churn statistics or not, they still represent a reduction of subscribers in the industry. These adjustments to what is and is not a subscriber and where that gets counted provide valuable insights into the health of the wireless industry.
In the chart below, we are looking at the overall phone universe and see that the two segments have more overlap than what many people want to acknowledge. The orthodox, adjustment-free view shows us solid growth over the last two years and creates the perception that industry growth exceeds population growth followed by exasperated questions of “Where are they all coming from?”
When we look at the impact of the adjustments, a different view emerges. For example, in Q2 2020 there were two significant adjustments: a clean-up of the Keep America Connected disconnects by AT&T and, more importantly, a large adjustment by T-Mobile as part of the Sprint merger. Sprint had created a bit of a mess ahead of the merger and counted people as customers who might really live up to that moniker. It counted some connected devices as phones, didn’t disconnect people even though they were significantly in arrears, and counted prepaid Boost customers who financed a device as postpaid. As a result, 1.9 million subscribers disappeared from the books. The total subscriber numbers actually show a reduction of 900k subscribers despite an “official” 1.3 million subscriber gain. We saw a similar trend due to the 3G network shutdown at AT&T and T-Mobile. What looked like strong subscriber gain quarters were actually flat quarters due to the disconnects of 1.9 million and 2 million 3G subscribers. We will see further adjustments when Verizon shuts down its 3G later in the year.
The interesting implication of the adjustments and their use to net out the official numbers is that the three mobile network operators did not add subscribers in the first half of 2022. The entire growth of the wireless sector comes from the cable industry in the form of Charter and Comcast.
In 2011, Verizon was in a pickle as it could project when it would run out of spectrum and needed to maintain its strategy of being the network leader in the United States. The deal was straightforward: get spectrum from the cable companies in exchange for an MVNO agreement and hope that the cable companies will be as successful as they were in their previous attempts with Sprint, which is not at all. This premise held up until 2017, when Comcast started offering service, followed shortly thereafter by Charter. The two cable operators went to market by positing that they could offer the best network experience for combined mobile and home internet for roughly the price of a premium wireless subscription. Customers liked the premise, and cable providers have consistently been between a quarter and a third of industry postpaid net adds, taking a healthy bite of the wireless industry growth. Examining Comcast’s and Charter’s total market flow share performance, which includes prepaid and postpaid, it becomes clear that Verizon is coming out ahead. For example, during July 2022, based on our Recon Analytics Data services, only 27% Comcast’s and Charter’s customers have come from Verizon. Tracking Verizon’s revenue components for many years, we estimate that Verizon gets an average of $13.13 from its MVNOs per customer, which include providers like US Mobile, Red Pocket Mobile, Lively, Affinity Cellular to mention only a few. A comparison between Verizon’s $18.35 EBITDA contribution and its $13.13 MVNO revenue per customer, which is almost pure profit, shows that Verizon is coming out significantly ahead. For every Verizon customer that moves to Comcast and Charter, three join the Verizon network from other providers, both postpaid and prepaid. The 661,000 Comcast and Charter net adds in Q2 2022 contributed an incremental $41.4 million in overall annualized revenue. If Verizon would disclose more numbers and be more transparent, it could easily dispel the erroneous notion that its wholesale business is a negative for the overall business when it is clearly not. While Verizon’s branded subscriber base which it reports quarterly is under pressure, its unreported network share is performing substantially better. More people are using the Verizon network today than ever before, and its wholesale partners are an underappreciated part of the story.
The headwinds that Verizon is facing are coming from its two main rivals T-Mobile and AT&T. T-Mobile continues to perform well with a “have your cake and eat it too” positioning by marketing a superior network at a lower price value proposition. Considering that it trails AT&T in postpaid phone net adds, we can only conclude that the message could be resonating better. AT&T is leading the industry with a straight-forward consistent promotion strategy for new and existing customers. The lack of fading-in and fading-out promotions that the two other operators are offering is paying off for AT&T. The new AT&T leadership has transformed the company from being the source of everyone else’s growth to being the fastest growing postpaid phone provider in the United States.
To take the fight back to the cable providers and utilize fallow spectrum, T-Mobile and Verizon have launched fixed wireless internet access to compete against traditional home internet providers. With 2.1 million fixed wireless customers between them, they have captured the buzz of the telecom market. With easy to set up wireless routers, straight forward pricing, and speeds around 100 to 300 Mbps, FWA providers are on top of Recon Analytics’ net promoter score list in every one of the 14 metrics we are tracking. What we see in our FWA flow share analysis is that FWA is currently a threat to every other technology, as it captures many disgruntled home internet subscribers who are looking for a different, attractively priced option. The questions are: How long can this last? and From where geographically do these customers come?
The main constraining factor is the availability of fallow spectrum and the usage profile of home internet users. It is not uncommon that home internet users use 500 to 800 GB per month compared to approximately 15 GB for a mobile user, while paying around less than $50 per month for their subscription. In urban and suburban areas, due to the much higher population density and approximately the same amount of spectrum, the maximum amount of fixed wireless customers before they impact wireless user experience is much more limited than in rural areas. In rural markets, fixed wireless access performance is much more driven by cell site density rather than the availability of spectrum. At the same time, rural America has the problem of being by definition rural, which means not a lot of people live there.
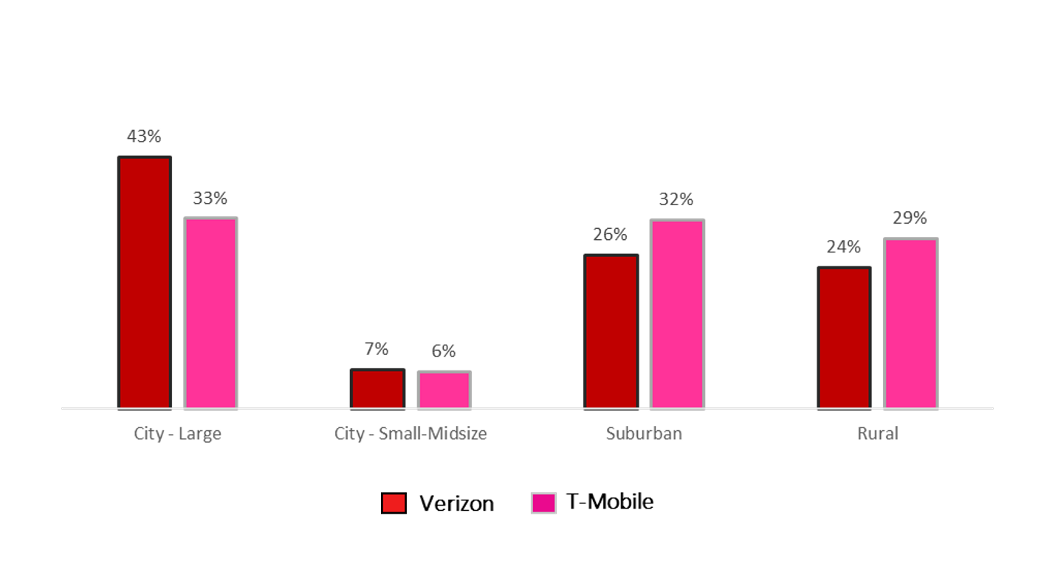
Fixed Wireless Subscriber by Urbanicity
Source: Recon Analytics Data, April to August 2022
Both Verizon and T-Mobile have been a lot more successful in urban and suburban markets than in rural markets, which is both an opportunity and limiting factor at the same time. The much-touted transformation of rural connectivity is still a lot more talk than reality. T-Mobile’s new Home Internet Lite plan demonstrates the strain on the network from unlimited plans. It introduces usage-capped price plans in the name of being customer friendly and allowing to be available everywhere. The positioning will be that not everyone needs unlimited data and with a fixed amount of data rather than unlimited data these customers and it allows T-Mobile to charge a higher price per GB in constraint areas. At the same time, it makes T-Mobile closer to the cable companies it derided in the past that have usage caps. It also proves AT&T’s argument that fixed wireless is not a fiber replacement in many places.
The competitive intensity is greater than ever before and the battle ground is larger than before. The battle for market share in this new converged communications provider world has just begun, with the tides of the battle swinging back and forth.
In case you are just tuning in, Verizon has been going through a rough time for about two years now. In fall 2021, it replaced Ronan Dunne as CEO of Verizon’s Consumer Group (VCG) as it struggled before filling the position with Manon Brouillette. It would be difficult to say that things have improved.
We live in peculiar times. For a long time, financial analysts wanted to convince us that when a mobile network operator (MNO) has a larger size than its competitors, the size advantage gives them a substantial edge in the market. Now, other financial analysts want to convince us that Verizon, because it is the largest provider in the market, is destined to lose customers for the foreseeable future. I disagree with both positions but would point to having a good plan, the ability to rapidly adapt to new circumstances, and superior execution to being the only sustainable competitive advantage in the market.
Verizon has traditionally differentiated itself as the premium provider in the market based on superior network performance. Taking network leadership to heart, Verizon charged ahead in 2G, 3G and 4G and created the fastest and largest network for at least the first three to four years of what is generally a seven-year technology era. The shock and awe of the early, rapid build created a nimbus of permanent network superiority even though, at least in urban markets, by year five, we had network parity. In contrast, in rural markets the network superiority persisted.
For the last decade, Verizon has internally fretted about what it should do if and when this trick would no longer work and its network superiority nimbus would be diminished, or even worse, large swaths of customers would perceive network parity or, even worse, someone else to have the better network.
Several poor decisions and outcomes around spectrum auctions weakened the strong network foundation. Verizon seems to have then tried to replace the internal differentiation of being the provider of the undisputedly best network with having the best streaming bundle and differentiating around that.
Replacing an internally generated differentiation with an externally acquired differentiation, especially when it is so easily replicable, is a dangerous gamble. To make this decision even more puzzling, Verizon engaged in the content-differentiation strategy at the same time when AT&T exited the content bundling with wireless.
AT&T and T-Mobile having seen the 2G, 3G and 4G outcomes decided they didn’t want to live through the same experience with 5G and put a lot more emphasis on network performance. While in Recon Analytics Data weekly net promoter score data, Verizon still leads in the network performance categories, the gap has undoubtedly diminished. Metered speed tests show Verizon being behind, but how much does it matter? In our purchase decision factor ranking, speed is a solid second out of nine metrics.
Especially T-Mobile, powered by Sprint’s spectrum and a greater network focus with various firsts has given Verizon’s network team a run for its money. AT&T has been more judicious in spectrum expenditures and build-out pace betting that speed test results alone don’t win customers and aligning its build-out more with customer and technical capabilities and usage. The slower build-out has not hurt AT&T’s success in the marketplace because it was able to execute on other purchase factors that existing and prospective customers find important.
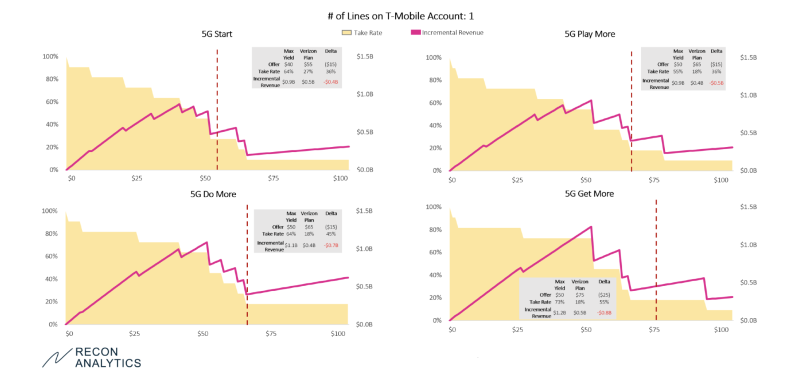
Verizon’s recent promotion
On May 22, 2022, Verizon launched an online promotion where single-line customers would get $15 off, two-line customers $12.50 per line off, and three-line customers got $5 per line off. Since Verizon did not issue a press release around it, it was largely unreported.
We took it as an opportunity to test Verizon’s value proposition of all plans – 5G Start, 5G Play More, 5G Do More, and 5G Get More – against what the customers of the other providers, ranging from T-Mobile and AT&T to Google Fi and Mint Mobile, were willing to pay for the different plans for a different number of lines. This gave our clients one week later a read if they should worry, to what degree, and about what part of Verizon’s promotion they should be worried about.
Below is how just T-Mobile customers were viewing Verizon’s single-line plans and for what price they would switch to the plan. While this is no sophisticated conjoint pricing analysis, it nevertheless gives some interesting insights. It also does not consider larger long-term pricing strategies that a company like Verizon would have to consider when making pricing decisions. The yellow shading represents the take rate at a given price point, while the magenta line represents the revenue that would be realized.
With the promotion, Verizon charged for a single line $55 for 5G Start, $65 for 5G Play More, or 5G Do More, and $75 for 5G Get More. As a reference point, Verizon just launched Welcome Unlimited for $65 for a single line for a skinnier offer than 5G Start.
T-Mobile customers’ highest revenue price point was $40 with a 64% take rate for 5G Start vis-à-vis Verizon’s $55 promotion. 5G Play More and 5G Do More were valued at $50 with 55% and 64% take rates respectively while Verizon was charging $65. Verizon 5G Get More plan discounted to $75 during the promotion was also valued at $50 with a 73% take rate.
Analyzing the data as in the above example vis-à-vis T-Mobile, it became apparent that in the one-line segment, the Verizon promotion would not save Verizon’s quarter. The numbers for the other providers for single-line customers were roughly similar to those of T-Mobile customers.
Interestingly, despite being the least generous, the three-line offer was the most competitive for several of Verizon’s offers. This brings us back to Verizon’s new Welcome Unlimited plan. It looks like a significant uphill battle to convince single-line customers to spend $65 per month when only two months ago, at least T-Mobile customers thought it was only $40 worth.
As I mentioned before, customers of different mobile service providers and for different line counts value Verizon’s plans differently, but in the one- and two-line part of the market a similar picture emerged.
Verizon isn’t suffering from a large size that dooms its progress; it suffers from a value positioning, value perception, and long-term pricing strategy issue.
There is broad agreement in the United States that we need to increase broadband coverage and make broadband more affordable for low income Americans. To arrive to that conclusion, it is unnecessary and actually is counter-productive to use less than reliable data to make this point.
Thomas Philippon recently authored a paper entitled, “How Expensive are U.S. Broadband and Wireless Services.” In it he concludes the American consumers pay more for broadband and wireless services than consumers in other industrialized nations. Unfortunately, these conclusions appear to be based on data that are dated, incorrect, omitted or misinterpreted. The findings are actually a disservice to the goal of closing the digital divide that exists both in coverage and affordability.
Fixed broadband prices
To compare U.S. with European prices, the paper uses data collected by cable.co.uk, an advertising website in the UK that tries to convince UK customers to buy UK broadband services rather than relying on unbiased sources. It is not clear what expertise this company has at determining U.S. broadband prices (or interest in showing them to be economical) and conducting proper apples-to-apples international price comparisons. In particular, there are no data contained within cable.co.uk’s currently provided spreadsheet that allow a reviewer to ascertain that similar quality plans were sampled in each country. Indeed, this seems in doubt as in its most recent study, cable.co.uk reports that the plans it sampled from the U.S. had an average price of $59.99, with a minimum price of $29.99 and a maximum of $299.95. The magnitude of this variation suggests that the sampled plans varied widely in quality (i.e., offered speeds), and it is especially curious that cable.Co.UK’s computed average speed should be $59.99. For an average from 26 observations to arrive at this archetypical retail price number seems improbable.
Indeed, it is highly likely that the quality of broadband services that cable.co.uk compares are quite different. In its current report on prices, cable.co.uk suggests that readers should also examine cable.co.uk’s study of worldwide broadband speeds. It is more than a little revealing that in the provided spreadsheet, cable.co.uk finds U.S. average speeds to be nearly twice as fast as UK speeds (71.20 Mbps vs. 37.82 Mbps). Furthermore, the only listed European countries or dependencies that exceed the U.S. in speed are:
Liechtenstein (population of 38,747)
Jersey (A British crown dependency of population of 107,800)
Andorra (77,142 people)
Gibraltar (a British Overseas Territory with 33,701 people),
Luxembourg (590,667 people)
Iceland (population 356,991),
Switzerland (8.5 million inhabitants),
Monaco (population of 38,964),
Hungary, (9.7 million people)
Netherlands (population of 17.2 million)
Malta, (460,297 inhabitants)
Denmark, (5.7 million people)
Aland Islands, (Swedish-speaking semi-autonomous region of Finland of 27,929 people)
Sweden, (10 million populations)
Slovakia (5.4 million people).
As you can easily see someone tried really hard to increase the count of geographies that have faster speeds than the US by including parts of countries, dependencies, and dutchies into the mix. Nearly all of these are small countries or semi-autonomous regions with populations less than a typical U.S. city or state. It is notable that no European country with a population larger than that of the Netherlands makes the list of countries with faster average services than the U.S. Given that U.S. broadband speeds exceed significantly those in Europe, and the U.S. generally has much lower population densities, higher wages, and thus, significantly higher per-home network deployment costs, it is unremarkable that U.S. prices might exceed European prices as it costs substantially more to deploy these networks.
The scatterplot of cable.co.uk’s collected prices appears to be consistent with 2017 prices reported by the OECD. But four-year-old prices don’t seem terribly apposite to debates about the current price and quality performance of broadband in the U.S. As demonstrated by USTelecom, broadband prices in the U.S. have been dropping significantly over the past six years even as their service quality has increased dramatically.
After noting that “some of the data measures presented above [in the paper about pricing] are a few years old,” the paper turns his concern to USTelecom’s recent report detailing that deployment of advanced networks is further along in the U.S., and subscription to these high speed U.S. networks exceeds European subscription to similar networks. The paper retort to these findings, that derive directly from data and official statistics collected for the U.S. by the FCC, and for Europe by the European Commission (EC)is to reference a 247-slide presentation published on internet that claims that in 2019, 87% percent of people in the U.S. use the internet, but in Western Europe and Northern Europe, the figures are 92% and 95%, respectively.[1]
There are at least two problems with this response. First, even if these data were valid, they focus on geographic subsections.[2] Why not compare these most-developed areas of Europe against U.S. figures strictly for the Northeast or the Pacific Coast? But aside from needing to slice and dice European data in order to adduce a favorable comparison, the biggest problem is that even if Europeans are using the internet, EC DESI data on connectivity show that many are not using it via a fixed broadband connection. This is because the EC finds that only 78% of European households subscribed to fixed broadband in 2019. So it is more than likely that the slide presentation the paper cites to on usage includes people who use the internet via mobile wireless broadband connections, satellite connections and dial-up internet connections, in addition to fixed line broadband connections.[3] In any event, one year earlier, in 2018, 84% of U.S. households had fixed broadband subscriptions – and the U.S. advantage over Europe widens as only 30+ Mbps broadband speeds and 100+ Mbps speeds are considered.
Fixed broadband speeds
The next topic specifically addressed by the paper is fixed broadband connection speeds. For this, the paper refers to slide 52 in the 247-slide presentation. This slide, he says, “shows the US is close to the EU median, and slightly below France, in terms of speed.” The first statement appears to be false, the second is immaterial. Let’s unpack.
The European countries listed (in terms of speed) on the slide are: Romania, Switzerland, France, Sweden, Spain, Denmark, Netherlands, Portugal, Poland, Belgium, Germany, Ireland, U.K., Italy and Austria.[4] The U.S.A. slots between Sweden and Spain. Now even assuming that the paper meant these comparisons to be against European countries rather than EU countries as he states in the paper, the median European country is Portugal – which lies four positions below the U.S. If only EU countries are considered, the median position drops another half slot to be between Portugal and Poland.[5] While the paper may consider the U.S.’ positioning in these lists to be “close” to the median, he could also have noted that the only major EU country ahead of the U.S. was France, with a miniscule (and likely statistically meaningless) speed advantage of 500 Kbps (131.3 Mbps for France versus 130.8 Mbps for the U.S.).
Thus, rather than showing the U.S. to be a laggard in fixed broadband speeds, the paper’s analysis appears to show it significantly in the lead.
Lightning round
ARPU: The paper then claims to look at broadband ARPU for Altice and Comcast in the U.S., and pronounces it significantly above that in France. The validity of his data is highly questionable, though. For example, Philippon claims (without citation) that Altice’s ARPU is $90/month.[6] Reference to Altice’s SEC 10-K report (at p. 3) indicates that its residential broadband ARPU is $70.52, a figure substantially less than Philippon’s unreferenced figure of $90. Further, Altice is a cable company with a very substantial FTTH footprint. It reports that the average speed purchased by its customers exceeds 300 Mbps – over twice the average speed experienced by French customers.
Prices of comparable contracts: A chart is displayed suggesting that prices for triple-play services in the U.S. exceed significantly those in European countries. This statistic is likely meaningless because it is well known that the cost of television services in U.S. triple-plays is vastly above similar charges in Europe. This is due to many factors, including: U.S. bundles typically include many more channels, especially HD channels, than European bundles; fees paid by U.S. triple-play operators to acquire local broadcast channels, sports channels and other cable television networks exceed greatly those paid in Europe. Indeed, in many European countries, local broadcast channels are paid for via television license fees that are paid separately by customers and are not included in their triple-play bills; U.S. bundles also commonly allow the subscriber to watch several simultaneous programs on multiple television sets – in contrast to European bundles that may be restricted to a single TV set stream.
Labor cost adjustment: Here the paper argues that because “wages are about 20% higher in America than in the main EU countries” and “since compensation of employees accounts for half of the value added in private industries, one might expect [U.S.] price to be [only] 10% higher” than in Europe. This analysis is not compelling. Even if these national-level statistics are specifically applicable to the U.S. broadband industry, there is no need for wage differences to account for the entire amount of any putative elevation in U.S. broadband prices over European ones. That is, they are only a contributor. The fact that the U.S. is much less densely populated than Europe and U.S. networks provide much higher speeds and carry much more data per household than European ones are also likely contributors.
Profits and investment: This section contains a mishmash of data that purport to suggest that U.S. capital investment is not impressive. But, the data presented for “Comcast, AT&T, and other Telecom companies,” not an appropriate basis for analysis because many of these companies are diversified into businesses other than broadband. Comcast and AT&T offer television services and own movie studios. Comcast owns theme parks and AT&T owns legacy copper telephone networks and DBS satellite systems. Consolidated capex figures from these companies are inadequate to discern broadband-specific investments.
But in any event, discussion of the above is probably intended to divert attention away from the best available investment comparator for telecommunications, the data collected by the OECD from national statistical agencies or regulators.[7]
All that the paper appears to say in response to the investment history presented in above chart is to note that since 2015, “investment by the main Telecom operators in Europe has grown rather quickly.” So it has; but so has investment grown in the U.S. – and U.S. per capita investment levels remain at nearly twice those in Europe.
Coda
It is odd that the paper should resort to such a strange mix of data that are old, wrong, or misinterpreted to try to support his claim that U.S. broadband is too expensive, and that this can only be the result of a lack of competition. Only by ignoring the fact that broadband networks are more widely deployed in the U.S. than in Europe, offer higher speeds, carry more data, and are more heavily subscribed to can the paper conclude that the European model is to be preferred. But while that may be the paper’s conclusion, it is not that of the European Commission which has studied these issues directly. In Table 7 of Annex 3 in its International Digital Economy and Society Index specifically for connectivity finds the U.S. to score higher than all but the top EU country (Denmark) and to tie in score with the next two highest EU countries (Finland and Malta).[8] All other EU countries score lower.
So the real truth is that U.S. fixed broadband leads, and does not lag Europe’s performance. This does not take away that there are Americans that cannot get broadband internet or cannot afford broadband. We need to help these people and do not need to trump up the differences to come to that conclusion.
[1] Curiously, the paper ascribes his data source’s stated figure of 87% usage for North America to be the usage figure specific to the U.S. This, of course, neglects the fact that roughly 10% of North America’s inhabitants are Canadians.
[2] The sources cited for this agglomeration of statistics (slide 34 of 247) are not traceable. They include: ITU, Global Web Index, GSMA Intelligence, Eurostat, Social Media Platforms’ Self-Service Advertising Tools, Local Government Bodies and Regulatory Authorities, APJ۩, and United Nations. Indeed, this same boilerplate list of sources appears on several other slides in the presentation.
[4] Turkey (which is below Austria in speed) is possibly another European country on the slide, but out of conservatism, we will not include it in our analysis.
[5] The EU countries contained in the slide’s list are: Romania, France, Sweden, Spain, Denmark, Netherlands, Portugal, Poland, Belgium, Germany, Ireland, U.K., Italy and Austria. Switzerland in not an EU country. Note that the U.K. was still a member of the EU when these data were collected.
[6] We assume this is intended to be residential ARPU because the paper compares it against a French statistic for residential broadband prices.
Americans overwhelmingly support that broadband should be available to every American and that the funding base to achieve that should be broadened to every company that makes money through the internet.
More than 78% of respondents agreed that broadband internet should be available to every American showing broad support from large parts of the population. When looking a bit closer at the answers given by respondents who say they have broadband versus the people who said they didn’t have broadband, the support of those respondents who do not have what they consider broadband (26%) for everyone having access to broadband drops to 64%. This indicates that there is not only an availability and affordability gap but also an educational gap. Many people who don’t have broadband internet access either do not want it or do not understand why they should have it. These findings, which are mirrored in other studies, indicate that any broadband infrastructure program should include an educational component to increase the number of broadband subscribers. Otherwise, broadband penetration will never reach its full potential.
As we found in previous surveys on the topic, around 54% of respondents use the internet for work purposes from home. This is equal to the number of employees that are classified as white-collar employees by the U.S. Department of Labor. This number highlights the importance of broadband for the functioning of American businesses and enterprises during the continuing pandemic. It is likely that the added agility and flexibility to work from home will continue to be utilized after the country has emerged from the pandemic restrictions. We also found similar opinions around what Americans consider broadband. The median American considers 50/5 MBits as broadband whereas the most answered response was Gigabit speed with 29% of respondents.
The high percentage of Americans who think broadband should be available to everyone is probably based on the intensive usage and the need of many Americans to use it from home to work. Using the weighted average of the responses, Americans spend around six hours every day on the internet.
How many hours do you spend on the internet with a mobile device or computer?
Use the internet from home for work
Does not use the internet from home for work
Combined Response
Less than an hour
4.8%
18.0%
10.9%
Two to four hours
18.1%
36.0%
26.4%
Four to six hours
15.2%
26.3%
20.4%
Six to eight hours
25.2%
8.8%
17.6%
Eight to twelve hours
25.7%
4.8%
16.0%
More than twelve hours
11.0%
6.0%
8.7%
When looking at those who also use the internet from to work from home, unsurprisingly the usage pattern is significantly heavier as their usage pattern includes both business and leisure activities.
While only 37% of respondents knew that the Lifeline Program provides low-income Americans with basic phone and internet service, they were open to new funding sources to close the digital divide. More than 71% of Americans are in favor that companies with business models that rely solely on the internet to exist and who also generate revenue from those businesses, like Google and Facebook, also contributing to provide access to Americans who currently do not have access to the internet. Such a move would dramatically expand the funding sources for a broadband access plan and include companies that have exerted the most valuable and profits from the internet.
What is really interesting, the survey also found support to extend net neutrality rules to websites and ecommerce companies. We framed questions around the net neutrality principles of no blocking, no throttling speeds, and no paid prioritization by asking Americans if websites like Google, Facebook or Amazon should be allowed to restrict access to legal sites, give preference to their own products and services over others and change the search results based on how much money they receive from others.
More than 72% of Americans are against companies like Facebook or Google restricting access to legal sites for any reason. This is exactly the behavior that Facebook showed when it made it impossible to link from Facebook to news sites in Australia (and for a short time to itself) to avoid having to compensate news sites linked to. In essence, it was a commercial and legislative conflict where Facebook wanted to use its customer base as a bargaining chip in its negotiations. This is the essence of the “No Blocking” rule in net neutrality.
More than 55% of Americans believe companies like Amazon, Google, or Facebook should not be allowed to give preference to their own products and services over that of others, a self-dealing practice that has cost Google more than $10 billion in fines by the European Union. Search engines like Amazon, Google, and Facebook, all of which provide you with what you are looking for, are increasingly the prism through which we see the world. They have incredible power over our perception of what it is we are actually looking for. By pushing competing products into the obscurity of lower-ranked results, they, in essence, throttle the success of other products that are better but do not fit the commercial objective of the search engine provider.
In terms of pay-to-play result manipulation, more than 80% of Americans say they are against search engines altering results based on how much websites and advertisers pay for preferential positioning. It is common that the first view search results for a given term are occupied by responses that are marked by the easily missed word “Ad” in front of the link. This effectively operates as paid prioritization, something the ISPs are not allowed to do under California’s net neutrality law, nor under earlier versions of net neutrality that the Democrats might be considering reinstating.
The results of our survey showcase two key points: Americans are open to reigning in tech giants, who solely rely on the internet to generate revenue, and curbing their ongoing uncompetitive behavior, and having these companies contribute part of said revenues to subsidize access to broadband for low-income Americans. While the Biden Administration focuses on proposing ideas that have been tried and tested, perhaps it should take a step back and listen to consumers, who are those who the administration ought to serve and prioritize.
While we all agree that the United States needs more broadband and net neutrality, most Americans do not support the Biden administration’s plan. The majority of Americans want internet companies to pay their share to build the broadband network that these companies are profiting from. They also want to be protected from the demonstrated behavior of internet-based companies that violate the net neutrality rules that these companies want to impose on other companies but not themselves. Net neutrality rules need to protect consumers and not one set of companies that want to prevent other companies to effectively compete with them. Any net neutrality rules that do not apply to internet service providers and internet companies like search engines, social media companies, and e-commerce providers is just cleverly disguised corporate welfare with the government picking winners and losers.
Between March 16 and March 26, 2021, Recon Analytics conducted a demographically representative survey of 1,000 Americans using the internet and cell phones, asking them about their opinions and attitudes around universal access, funding mechanisms, conduct, and usage.
Do you believe that access to broadband internet should be available to every American?
Yes 78.2% No 21.8%
Did you know that the government requires a small portion of your phone bill to be used to fund phone service for low-income Americans aka lifeline service?
No 62.9% Yes 37.1%
Do you think companies like Google and Facebook that make money through the internet should contribute to the provide access for Americans who do not have the internet?
Yes 71.4% No 28.6%
Should companies like Google or Facebook be allowed to restrict access to legal sites for any reason?
No 72.7% Yes 27.3%
Should companies like Amazon, Google, or Facebook be allowed to give preference to their own products and services?
No 55.8% Yes 44.2%
Should search engines be allowed to alter search results based on how much money they receive from websites or advertisers?
No 80.6% Yes 19.4%
How would you define broadband internet access?
3/1 9.3% 10/1 9%
25/3 14.8% 50/5 17.3%
100/10 20.9% Gigabit 28.8%
Do you currently have broadband internet access?
Yes 74.2% No 25.8%
Does your job require internet access at home?
Yes 53.4% No 46.6%
How much time per day do you spend on the internet (via your mobile device or on your computer?)
With the advent of 5G and, with it, a technology called network slicing, many parties, ranging from mobile network operators and enterprises to policymakers, are re-examining how to deploy customized networks that were previously unfeasible. The flexibility afforded by network slicing will allow wireless operators to more efficiently meet the needs of their enterprise customers, particularly those customers concerned about the potential costs or burdens of “do-it-yourself” or outsourced private networks. Alternatively enterprises may choose to deploy a private wireless network to meet their needs. This would require a specific plan to utilize spectrum they obtain or lease from another entity along with a private network managed by an operator, network supplier, or viable third party.
Network slicing allows a network operator using the same physical wireless network to provide virtual slices with different characteristics to serve different customer needs. It allows the operator to tailor the technical characteristics such as bandwidth, latency, and security for certain types of applications. This is especially significant for enterprise customers whose desire to enjoy the economic benefits associated with large-scale network operators; instead of defaulting to largely homogenized offerings, companies and operators now enjoy unprecedented flexibility to develop customized solutions at a much lower cost.
Flexibility comes from the move towards virtualization and software-defined networking, where network infrastructure that was an integrated software and hardware component becomes disaggregated into a software program running on general purpose computers and servers.
Cost savings come from the shared use of physical infrastructure when the new specialized tasks only require the installation of a new software application solving, the enterprise’s specific need.
The enhanced capabilities and cost savings allow enterprises to switch from a production process that has been hardwired to a flexible wireless approach, just as mobile phones have replaced landline phones as the preferred way to communicate. In particular, the development of network slicing allows providers and customers throughout the wireless ecosystem to continue to enjoy the efficiencies of flexible use licenses and larger geographic license sizes, while also benefitting from small-scale customization.
5G Network Slicing
Over the last five years, the concepts of software defined networking (SDN) and network function virtualization (NFV) have taken large strides in the telecom world. The change from application-specific hardware to networks that are built on a general-purpose computing foundation, implemented and orchestrated by software, is a watershed event. The typical wireless network of 2015 consisted of roughly 30,000 to 50,000 different pieces of hardware with integrated software. The hardware elements (also called SKU for Stock Keeping Units) included base stations, internet routers, messaging gateways, multimedia gateways, switches and many other components. For every function in the network, one new SKU was created. These SKUs are highly efficient at running the specific task for which they are designed as long as they are close to being fully utilized. The networks are also designed around the busiest time of the day for the specific function, plus a significant margin for growth so that customers can always use any function they might want to at any time of the day. Usage is highly variable both over time and across functions which are being used, leading to a significant amount of idle capacity and significant cost.
As MNOs have transformed their networks from hardware-centric to software-centric, wireless networks have become a lot more flexible. By being able to use each network function as an application, these developments have allowed MNOs to create network slices that provide service assurance by creating virtual wireless networks as part of the overall wireless network.
The key advantages of network slicing are:
Enhanced mobile broadband. It allows the operator to guarantee reliable, ultra-high speed data connections for applications such as live 4k video streams.
Very low latency. It makes applications such drone flying beyond visual range possible and among other things opens up the ability to inspect power lines and buildings.
Massive IoT. Thousands of IoT devices such as sensors can be installed per square mile allowing for a range of applications such extremely even temperature control on a shop floor where material variances are measured in mu requiring temperatures to be within one degree for product uniformity.
Importantly, these key advantages can be mixed and matched to suit different industry verticals, all over the same physical network.
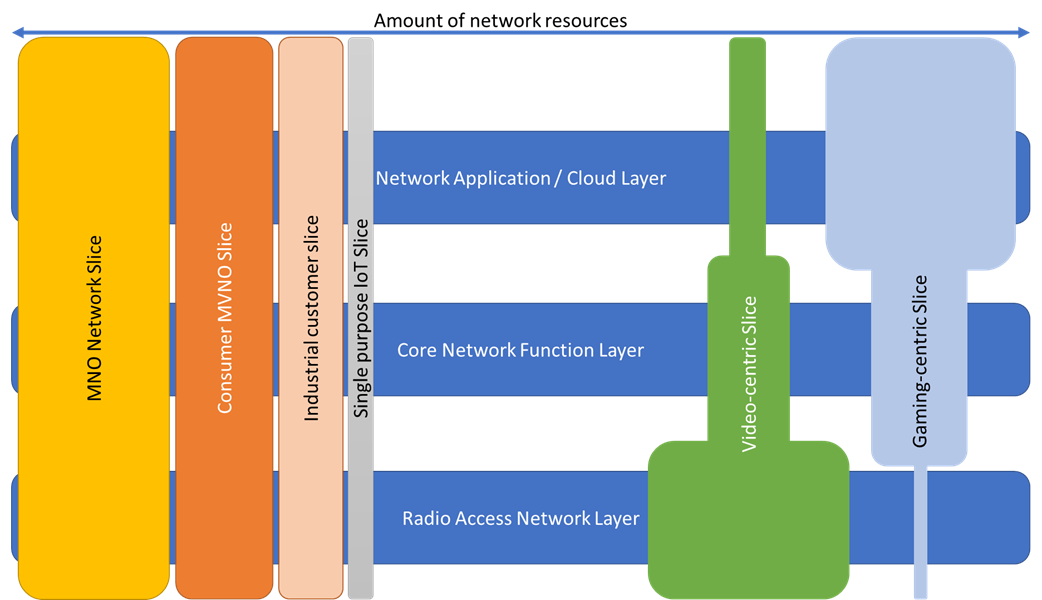
Below in Exhibit 1, we have abstracted the network into three layers: The radio access network (RAN) layer, which is responsible for the wireless connectivity between the device and the network; the core network function layer (core) that controls how voice calls and data sessions are connected; and the network application layer on which the various services run. The network application layer consists of either a private or public cloud, centralized or at the edge of the network. This way, a specific amount of resources can be allocated to every network task. In the exhibit, the width of the bars is the amount of resources guaranteed to each slice. The MNO can thereby guarantee all customers who have bought a network slice a minimum performance through a service level agreement (SLA.)
For example, the MNO has set aside a specific amount of network resources for its retail or consumer customers (the MNO Network Slice). Since its customers are using a balanced number of applications, it needs a corresponding amount of core and RAN resources to serve all of its customers, both consumers and enterprise customers, well. The MNO is also hosting an MVNO which is smaller than the MNO and has therefore purchased fewer network resources that are also balanced. The same with a large industrial provider and an IoT provider who have created their own private networks by acquiring smaller slices of the network. On the right side of the exhibit are two examples that show the strength of the network slicing model. In the green case, a customer purchases a video-centric slice, either for internal use like a large close circuit video network or a company providing video services to its customers. Video is the RAN killer app, both in terms of popularity and in terms of RAN resources needed. For that reason, the company purchases a significant amount of RAN resources. At the same time, a single use needs less core resources and even fewer resources at the network application layer, may it be in the form of a private, public or mobile edge cloud, as it streams the video. A contrasting example would be a game-centric slice. Multi-player online games are not data intensive, using only a small fraction of the data bandwidth that a video stream uses, but are highly latency dependent. To ensure the required latency, gaming demands a service with a higher amount of core resources and an even higher amount of network application resources where the processor-intensive calculation takes place.
Exhibit 1:
Source: Recon Analytics, 2021
Network slicing allows MNO administrators to custom tailor which resources are needed to deliver the services that the customer wants and needs by guaranteeing their availability at the network level.
Building a wireless network involves a significant amount of investment regardless of whether the network serves one customer or one hundred million customers. Building a RAN with towers, antennas and radio heads, a core network and application network layer with servers is a significant undertaking, even for established MNOs. Network slicing allows non-telecom companies to have the benefits of a private, secure, custom-tailored network meeting their needs without having to build, manage, maintain and upgrade it themselves. It is the difference between building your own car and leasing a car to drive to work every day.
Telecom engineers were determined to discover better ways to run a network than with 50,000 individual components. Using data centers and even personal computers as an example, they posited that it would be more efficient, flexible and agile to virtualize network functions (NFV), turning the vast majority of SKUs into computer programs and using general purpose computers or servers to create what is known as software-defined networking (SDN). This solves various issues:
Agility: With an SDN it is much easier to launch new products and services. Instead of having to justify the cost and complexity of having to add another SKU to the network, mobile network operators (MNOs) can simply launch the service by starting the software program. Adding a new service becomes (almost) as easy as installing a new browser or word processor on a PC. If the service is successful, it takes up more data center resources, using excess capacity of a service that has fallen out of favor. If wildly successful, the MNO can simply add more servers. If the service fails to catch on, the application either uses minimal network resources or is deleted. Thus there is no need to pay for, install, and potentially remove hardware from the network.
Reduction in network complexity and cost: As mentioned before, an average mobile network has 30,000 to 50,000 different SKUs performing different network functions. The fully virtualized SDNs that are operational today have reduced that number to six.. Fewer network elements means less complicated and expensive maintenance and purchasing costs as well as fewer hardware incompatibilities that need to be overcome. With fewer network elements, fewer people are needed to operate the network, thereby lowering operating costs. Since the network runs on a large number of commoditized servers that are interchangeable, costs are lower due to larger purchase volumes of generally available commoditized hardware.
Speed and scale of innovation: By using standardized, general purpose server hardware, wireless networks are joining the larger and faster speed of innovation rather than continuing to rely on the speed of innovation in niche applications. Furthermore, by shifting innovation to the software layer, many more companies can develop new software than what would be possible in an integrated hardware and software model.
Security and vendor independence: By using standardized hardware to run the network, it becomes less likely that malware gets introduced to the network through compromised hardware as the removal of compromised hardware is expensive and time consuming. If any software is compromised, it can quickly and inexpensively be replaced by a competing product. Furthermore, by relying on software over standardized hardware, MNOs can much more easily switch from one vendor to another for technical or commercial reasons.
Ease of management: In an SDN, all virtualized network functions can be controlled and changed from one platform and one location. In a traditional wireless network, individual network elements have to be individually changed and monitored, often with different applications that do not work together, and the changes have to be made locally. Most importantly, when network software runs on standardized hardware, it is possible to allocate specific resources to predetermined tasks, something that is called network slicing.
Until now, enterprise customers whose operations were dependent on features like these were incented to build and operate (or outsource) their own customized networks, entailing significant capital and operational expenses since this approach would not incorporate the efficiencies passed through to customers by large-scale traditional mobile network operators. Network slicing now allows enterprise customers to share in those efficiencies of scale, while still gaining the advantages of network customization – the best of both worlds.
Network Slicing Use Cases
5G network slicing allows guaranteed network performance that was not possible in 4G. This allows mobile network operators to offer a whole new set of capabilities that were previously not possible.
Industrial use case
5G is ideal for factories as it removes the need to lay cables to run different machineries that cost in the hundreds of thousands of dollars depending on the size of the factory floor. Network slicing, with its guaranteed performance, allows factories to connect precision machinery that needs to react to changes in the production process with less than 10 millisecond reaction time, like metal works or chemical processes. It also allows the production process flow on the shop floor to be changed according to new and different tasks without incurring cost prohibitive expenses and time of rewiring the shop floor. In addition, the material flow on the shop floor can be automated and, with below 10 millisecond reaction time, centrally controlled. Work-in-progress material vehicles can shuttle material from work station to station. By shifting the work-in-progress material flow from manual labor to an automated process, the number of work-related accidents on the shop floor can be significantly reduced, improving employee health and decreasing work related healthcare costs.
Just like in the hospital use case, the industrial company can choose which elements and functions it wants to source from the mobile network operator and which parts it wants to own itself for maximum flexibility. For example, in an automobile manufacturing plant, the automobile manufacturer installs its own antenna network, uses its own industrial applications to run the robots and manufacturing street, but relies on the mobile network operator to integrate it and run it on the mobile operator core.
Drones beyond visual line of sight
One of the advantages of 5G and network slicing is the guaranteed low latency and high data through put. What has been an exclusive purview of the military, is coming to the civilian sector: Flying drones beyond the visual line of sight (BVLOS.) The FAA approved BVLOS flights for public safety in August 2020, with a commercial application approved in January 2021. Due to the reaction time limits by traditional technology the drone cannot be further away that 1,500 feet from the pilot and more than 50 feet above or within 400 feet horizontally of any obstacle. The 5G and network slicing operators can guarantee a stable connection and low latencies that will allow drones to fly wherever there is a network connection and much closer to buildings, cables, and anything else the FAA describes as obstacles. Powerlines, local and long-distances, as well as cell cites need to be visually inspected in regular intervals to ensure the structural integrity of the units is still warranted. Currently, a lot of these inspections are done either by car or on foot with binoculars or personnel has to climb up the structure to inspect it. Due to OSHA regulations, they have to be turn off to be inspected, which impacts customers. When the industry switches to BVLOS one drone pilot can inspect these structures from a central location leading to lower cost and improved inspections as the drone will deliver a 4k video stream that is then recorded. Successive videos of the same structures can be compared against previous recordings to evaluate how quickly the structure is withstanding environmental impacts and aging. This will allow for preventive maintenance reducing cost and uptime. For the public safety community, BVLOS provides the opportunity for firefighters to have a better view on forrest fires than what is possible with planes. Drones can fly closer and slower to the ground than planes or helicopters, without endangering a pilot, giving firefighters a better understanding of conditions before they fight the fire in person. Futhermore, use of augmented reality (AR) and virtual reality (VR) technology can aid flying the drones and better help with inspecting various pieces of equipment.
Augmented and virtual reality use case
Combining 5G with network slicing allows reliable and predictable performance of augmented and virtual reality applications. For example, television programs can use 5G to holographically capture interviews and events, transmit them to a TV studio, and project the live images, allowing people in the studio to interact with the holographic images. Examples of this include interviews from sports events where the athletes are projected straight into the studio to be interviewed. Network slicing is particularly useful for large, highly latency-sensitive data streams for multimedia applications, since it allows for the dedication of bandwidth and computational resources needed to ensure flawless delivery.
Secure banking use case
Mobile payment and banking applications that are currently operating on the common network can be enhanced by creating a network slice that is dedicated only to a bank or payment system’s dedicated network slice. This allows a complete separation of the payment and banking app from the commonly shared wireless network, allowing for greater security and flexibility.
International examples
The advent of network slicing increases the efficiency and attractiveness of larger geographic license sizes. Internationally, the most prevalent way spectrum is licensed is through nationwide licenses. Some large countries like Canada and Brazil follow the US model of splitting the country into a number of licenses. In particular, Canada with regional telecom providers has a similar system for the same reasons as the United States, namely to allow regional providers an opportunity to participate in the wireless market place.
With the advent of 5G, several European countries have set aside spectrum for Industry 4.0 companies in the 3.7 GHz to 3.8 GHz band. Despite its moniker, the licenses are available for all companies at costs that are in the thousands of dollars per year. One of the leading examples is Germany, with its significant manufacturing sector. The German government lays out four scenarios[1] of how German companies can get use a 5G campus network, ranging from a slice of a public network, a hybrid-shared RAN where the public RAN is supplemented with private small cells, a hybrid RAN with a private core, and a fully separate stand-alone network.
The premise of this approach is that allocating spectrum in smaller parcels to individual companies would be more efficient than allocating larger flexible use licenses to MNOs, but experience has not borne this out as the uptake has been limited and is projected to continue to be minor. The first companies that have made announcements on starting 5G private networks are either stand-alone networks or network slices, but almost all of them are being built together with an MNO, either as the provider of a slice or as the lead partner to the customer. For example, General Motors and Honeywell have a 5G indoor system deployed in the United States with Verizon[2]. In Germany, Lufthansa together with Vodafone has launched a stand-alone private 5G network[3] and OSRAM together with Deutsche Telekom has launched a hybrid slice network[4]. In the UK, Ford together with Vodafone[5] and Air France and Groupe ADP are planning a 5G network[6], and in China multiple companies are building or have already built 5G networks with China Mobile, China Telecom and China Unicom respectively[7].
Bitkom, the 2,700-member German industry association for the digital sector, conducted a survey of companies regarding their plans for 5G[8]. Half of all companies considered 5G an important factor for their company in the future. Thirty-six percent of companies are planning or discussing using a network slice from an MNO for their 5G needs and six percent are planning to use the 100 MHz license that the German government has set aside for private company networks. As one of the leading high-tech manufacturing countries in the world, the survey result showing that only six percent of German companies are interested in deploying a private 5G network, where the enterprise owns the radios, network core and applications, on dedicated spectrum is sobering. The advent of network slicing allows enterprises to avoid taking on those responsibilities while still enjoying the benefits of customization.
Opportunity cost of different license area sizes or licensing schemes
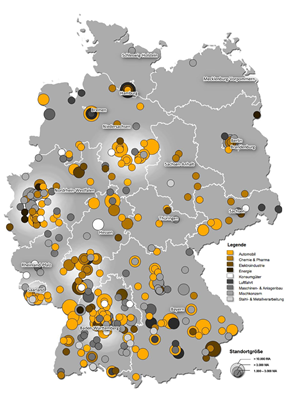
Exhibit 2: Industrial locations in Germany with more than 1,000 employees
Private networks, like the industrial networks envisioned in Germany, still require network design, someone who builds the network, operates it and maintains it. This is a challenge for even the largest industry providers. As a result, they are either looking to either large system integrators or mobile operators to provide these services.
An additional challenge is the relatively small license areas for these networks. The smaller the license area, the more challenging network design becomes. In the low- and mid-band, radio waves inevitably will travel further than the smallest, city-block-size census blocks in major metropolitan markets. This creates interference issues with neighboring antennas, especially if they are owned by a different licensee. The interference issue gets smaller with higher frequency spectrum as the signal is increasingly attenuated and has problems penetrating walls.
Another issue to consider is that if only a small number of companies are willing or eligible to use the spectrum, the unused spectrum lays fallow and cannot be used otherwise. This is particularly a problem for low and mid-band spectrum that would otherwise be deployed in wider areas.
Even in a country as large as Germany, with twice as many people than California on half the geography, larger businesses with more than 1,000 employees are highly concentrated as we can see in Exhibit 2[9]. In large swaths of Germany, 100 MHz of 5G spectrum that is reserved for companies will lie fallow as indicated by the large area of grey land and cannot be used for important tasks such as wireless broadband solutions to the home or businesses. This runs counter to the idea that MNOs in both urban and especially rural areas can solve connectivity issues driven by inadequate landline solutions. Network slicing by MNOs allows enterprise customers to avoid the inefficiencies of small license sizes, while still achieving the customization benefits of private networks,
Conclusion
5G and Network slicing are opening up new opportunities for consumers and businesses alike. It terms of added flexibility network sliceing is the best thing that happened to mobile networks since sliced bread. 5G, SND and network slicing eliminate the delineation between telecom and information technology and create a contiguous development space for software engineers. As software is eating the world, this includes wireless networks, just as wireless is eating the world as well. This development opens up new opportunities ranging from augmented and virtual reality to drones to more fully optimized factories.
The cost savings from replacing expensive cabling to reducing workplace accidents are significant as wireless connections replace wired connections. The increased flexibility of changing the workflow on a factory floor is substantial. The ability to fly drones beyond the line of sight will simplify many tasks requiring people on the ground to inspect structures. Considering that the core competency of regular companies is their specific focus and not that of running IT systems or even highly sophisticated 5G networks on a limited scale, the deployment scenarios we see in Germany and other European companies will be that of network slicing or a hybrid solution that MNOs will manage. While it is a possibility that we will see stand-alone networks, the trend in corporate support functions is towards outsourcing as it often provides a better solution at a lower cost.
Most companies have outsourced their entire IT segment to specialist companies that can provide a superior experience for a lower cost. Even email, a relatively simple application, has become a hosted solution provided by large IT companies. Network slicing allows for custom network applications previously deployed on private networks or not at all by essentially creating a network as a service approach, where connectivity is just one of the components of an enterprise solution. Network innovations that would take a separate investment in a private network come when using a network slice as the overall MNO network is being upgraded. By working with an MNO and using a network slice allows companies to benefit from technical innovation for free as the MNO will upgrade their network to remain competitive. As a stand-alone network the enterprise would have to bear the cost for it. Private networks are also an option, but each enterprise should consider the requirements to develop and manage such a network – from spectrum, to design, development, and ongoing operations.
Network slicing allows enterprises to have all the benefits of customized private networks without having to build, operate and keep current the network increasingly becoming essential to remain competitive.
This paper has been commissioned by CTIA – The Wireless Industry Association
Japan’s Rakuten is the first global mobile network operators (MNO) to fully virtualize their networks, with millions of active customers on commercial service. Rakuten has taken their expertise of being a fully virtualized operator to create the Rakuten Communications Platform (RCP), which packages its vendor portfolio and deployment expertise and markets it to other operators who also want to run their network in the cloud. Interestingly, the vendor product portfolio that is being sold is more extensive than what Rakuten has chosen to deploy. Based on news reports, Rakuten has already signed up 15 customers on RCP. The first publicly announced RCP trial partner is Ligado. A would-be US operator, Ligado owns spectrum in the United States that was previously used for satellite use. Up until recently Ligado has been involved in a fight with the Department of Defense over potential interference with GPS and NTIA, but the FCC sided with Ligado and allowed them to use their spectrum for commercial use.
Based on our research, the RCP universe consists of the following players:
Area
Company
4G Core
Cisco
Converged 4G/5G Core
NEC
Servers
Quanta
Service orchestration
Innoeye (acquired by Rakuten)
IMS/RCS
Mavenir
Open RAN software
Altiostar
4G Sub-6 GHz Radios
Nokia
5G Sub-6 GHz Radios
NEC
4G/5G Sub-6 GHz mmWave Radios and Software
Airspan
Qualcomm and Intel are also mentioned as RCP participants but apparently are mostly involved as silicon providers for their particular area of expertise.
Rakuten continues to use Innoeye and Altiostar, which it has purchased outright in Innoeye’s case or has an equity investment like Altiostar, for orchestration and Open RAN software, respectively. Mavenir continues to supply the IMS/RCS software and Quanta provides the servers.
RCP made several adjustments in its vendor portfolio when it added 5G support to the network. Rakuten switched from Cisco as a 4G packet core provider to NEC, which will work with Rakuten on building a converged 4G/5G core. NEC also replaced Nokia for the sub-6 GHz radios as Nokia only provides 4G radios for Rakuten. This change was surprising as the NEC 5G radios are actively cooled, whereas state-of-the-art radios are passively cooled. Rakuten did not switch mmWave radio providers which, Airspan continues to provide for 4G and 5G.
One of the powerful features of RCP is that an MNO can mix and match from any vendor in the RCP portfolio. If an MNO prefers Nokia or Airspan as their radio vendor, they can use Nokia’s mmWave product for 5G or use Airspan for both mmWave and sub-6 GHz Airspan’s Open RAN software or use Altiostar’s software.
RCP fits into an interesting sweet spot in the market. Most large MNOs, especially in the United States, will chart their own path towards Open RAN based on how it fits into the current network. Changing or introducing vendors for such a significant network transition is like changing an airplane’s engines in midflight. Small operators, especially if they have already chosen Huawei equipment, are locked in. These operators typically have lean engineering and operations staff that are not trained or sized for such a significant network transition. This makes small operators dependent on large network providers as prime project managers and for vendor financing. Huawei’s growth to become the largest global provider of 5G equipment to MNOs has been based on both significant deployment and customer service capability to the point where almost every Huawei-powered network is a custom network with generous vendor financing packages. A side effect of the customization of each network is that it makes it difficult for other vendors to get a part of the network equipment. Medium-size MNOs and greenfield operators, especially if they are not dependent on vendor financing and the small rural MNOs in the United States who have to replace the Huawei equipment in their network and are collectively paid $1.9 billion to do so are a prime target for RCP. Rakuten’s offering lets MNOs jump to state-of-the-art software-defined networks with Open RAN. Software-defined networks are more flexible and cheaper to operate and due to the standardization of hardware, they are less expensive to buy.
Especially the rural operators who are replacing their equipment should invest in the technology of the future, SDN, and Open RAN, regardless of whether they choose RCP or a custom route, rather than invest in the past’s integrated hardware and software. For rural MNOs who have to run their network with a lean team, SDN’s automation allows the network operation teams to be more efficient and effective. Before RCP, the path to SDN and Open RAN was quite daunting as, for example, Dish’s Charlie Ergen remarked during the Q4 2020 earnings call. RCP solves the complexity problem by allowing rural MNOs to use a working suite of products from another network operator. As a further bonus, several MNOs could combine their network operations and share a common core and operations team for additional cost benefits. Switching to SDN and Open RAN would also work with President Biden’s Buy American initiative. Several leaders in the field are American companies such as Airspan, Altiostar, Cisco, and Mavenir. For all too long, we have complained that there are no American telecom network equipment providers. Now the telecom industry has an opportunity to diversify its vendor base.
In recent years, the FTC raised concerns that Qualcomm’s patent portfolio and unbiased licensing scheme would prevent other companies from manufacturing and selling 5G chipsets, leading to an anti-trust lawsuit that concluded in November 2019. However, the prediction has not borne out. Currently, there are two companies, Qualcomm and MediaTek, that sell 5G chipsets to the device ecosphere at large, two captive suppliers who make their own 5G chipsets for internal consumption, and one company that is creating its own new 5G chipset also for internal consumption.
The mobile chipset business has a series of players with different objectives. Companies like Qualcomm and MediaTek provide mobile chipsets to device manufacturers and serve the vital function of ecosphere enablers. Without them, the plethora of devices and choices consumers enjoy when it comes to smartphones would not be possible. Another set of companies are making mobile chipsets only for themselves to create a competitive advantage in the marketplace. Apple and Samsung fall into this camp. Huawei is potentially a hybrid case as it was previously only providing its own handset group with chipsets, but now also provides them to a Chinese state-led consortium that purchased the Honor handset line.
Customer
Modem
Integrated SoC
Stand-alone Application Processor
RF Frontend
Qualcomm
Ecosphere
Yes
Yes
No
Yes
MediaTek
Ecosphere
No
Yes
No
No
Huawei
Divested divisions
Yes
Yes
Discontinued
No
Samsung
Captive
Yes
Yes
No
No
Apple
Captive
Future
Future
Yes
No
Intel (sold to Apple)
Ecosphere
Yes
No
Aborted
No
Currently, Qualcomm provides high-quality Systems on Chip (SOC) that are integrating multiple components, ranging from baseband, AI, graphics, camera, to CPU into one chip to anyone interested in them. Qualcomm was the first company to offer 5G chipsets with the first devices hitting the market at the end of 2019. MediaTek is offering a similar, but less advanced and less integrated product line to device manufacturers looking for low-level to medium-level chipsets. By the middle of 2020, MediaTek’s chipsets were powering a broad portfolio of handsets.
Intel, another ecosphere provider, sold its mobile chip business to Apple in December 2019, nine years after it entered the mobile chip market by buying a division of Infineon. Intel’s motivation to buy Infineon was that Infineon was the sole provider of modems to Apple. Reportedly during the negotiations between Intel and Infineon, then-Intel CEO Otellini sought reassurances from then-Apple CEO Steve Jobs that Apple would continue to use Infineon products after the Intel acquisition as Otellini recognized the importance of Apple as a customer for its chipsets. During the nine years after the Infineon acquisition, Intel’s mobile chipset division’s fate was intricately linked to Apple as Intel struggled to find other customers in the mobile device manufacturer ecosphere. In a nutshell, Intel was unable to compete with Qualcomm on quality like RF performance and SoC integration and was unwilling to compete with MediaTek as it had a more integrated solution and Intel did not. Intel ultimately threw in the towel on the heels of Apple and Qualcomm settling their lawsuit and agreeing to a six-plus two-year licensing and multiyear chipset supply agreement.
Huawei through its HiSilicon subsidiary has developed and used its own 5G chipsets and has integrated them into its own devices. While the Huawei chipsets are not as integrated and small as Qualcomm’s, Huawei’s engineers have found ways to integrate the chipsets into its devices. It is using Qualcomm, Skyworks and Qorvo, all from the US, for its RF front-end. Huawei’s role in the mobile world got a lot more interesting as it has sold its Honor-brand device division to a Chinese state-led consortium of more than three dozen companies as Huawei experienced a lot of pressure on its devices sales due to American sanctions. Reportedly, Huawei is also considering selling its Mate and P-line device groups in the hope that American sanctions will not follow to the new owners of the device businesses. Up until now, Huawei is not selling its HiSilicon chipsets to other companies, other than the group of Huawei dealers that acquired the Honor-brand device division, as a competitive weapon in order to keep their best technology capitive. In 2019, during the trade tensions between the US and China over Huawei, the company offered to license its 5G intellectual property to American companies to alleviate any spying concerns, but no deal has emerged until to date. If Huawei is divesting its entire device portfolio Huawei might either also divest its HiSilicon division with it or become an ecosphere provider for other handset manufacturers. The direction of Huawei’s HiSilicon business will be quite telling of the size of the Chinese walls between Huawei and its divested handset businesses as well as other handset vendors.
Samsung has been producing its own Exynos modems and mobile processors, and has also purchased mobile chipsets from Qualcomm. Samsung’s new 5G devices, including its S20 5G flagship smartphone, is shipping either with the Exynos or Qualcomm Snapdragon chipset. Samsung sells the Qualcomm variant in the US, China, and most recently South Korea, and its Exynos variant in the rest of the world. Benchmarking has shown that the Qualcomm chipset version regularly outperform the Exynos one and that Samsung uses the Qualcomm variant in the most competitive markets to close the gap against Apple’s iPhone.
In 2008, Apple with its computer heritage bought P.A. Semi, a processor development company specializing in highly power-efficient designs, to build its own ARM-based processors for iPhones, iPads, and similar devices. Apple’s ARM processors are now the fastest CPUs in the market and will start powering Apple Mac computers starting in 2021. Apple sourced its baseband chipset first from Infineon, then post-acquisition from Intel, then a few years later from Qualcomm, then dual-sourced from Intel and Qualcomm, and most recently in 2019, signed an agreement to return to Qualcomm. In 2019, Apple also bought Intel’s baseband chipset business and has started hiring more wireless engineers in San Diego, Qualcomm’s home market. Considering Apple’s track record it is quite logical that Apple is going to try to replicate its successful ARM processor endeavor in modems, and internally source its 5G mobile chipsets when the Qualcomm agreement expires. The Qualcomm agreement gives Apple breathing room to pour its resources into an area that is a key differentiator between mobile devices.
These successful 5G chipset endeavors demonstrate that Qualcomm’s patent portfolio and licensing policy do not present a significant barrier to innovation. Qualcomm’s licensing rates have not changed since it first started licensing CDMA in the 1990s, while its portfolio has grown substantially, facilitating continued innovation that has made the United States a leader in international telecommunications on a fair, reasonable, and non-discriminatory basis. As silicon merchants to the industry, Qualcomm and Mediatek’s participation in chipset development creates choice and opportunity for many mobile device manufacturers to have a chipset that meets their needs and budgets exponentially increases the range of consumer choices without infringing on the ability of other companies to enter the market.
The Super Bowl is not only the pinnacle of the American Football season, but it is also the show case event for wireless carrier. Every year, every wireless carrier sets aside tens of millions of dollars to improve the wireless network for the big game. The newest and best gets installed so that attendees and regular citizens alike get a superior experience. One of the challenges that mobile operators have to overcome in order to provide faster speeds is how to best use the spectrum they have. The spectrum portfolio of each carrier has different amounts of spectrum ranging from 600 MHz and 700 MHz all the way to 39 GHz. In order increase the speed for customers, the spectrum slivers can be bonded together in a process called carrier aggregation (CA). The maximum amount of spectrum that LTE can have in a channel is 20 MHz and 5G is 100 MHz. So even if a mobile network operator has 1,200 MHz of contiguous spectrum with 5G they could aggregate 12 100 MHz channel for the maximum amount of bandwith which directly translates into speed.
Global Wireless Solutions (GWS) conducted network testing during the 2021 Super Bowl in Tampa and provided some additional insights that typically don’t get mentioned with other tests. GWS found that AT&T used 8 channel CA using 800 MHz of its 39 MHz spectrum, Verizon used 6 CA using 600 MHz in 28 GHz, and T-Mobile 4 CA using 400 MHz in 39 GHz plus 80 MHz in the 2.5 GHz band. The availability using the 28 and 39 GHz band was almost the same for every carrier at 73% to 77%, which isn’t surprising considering the relatively small area covered. T-Mobile’s 2.5 GHz coverage added another 20% of coverage. Considering more spectrum means more speed, it comes as no surprise that AT&T was the fastest with peak speeds of 1.7 Gbps, Verizon with 1.5 Gbps and T-Mobile with 1.1 Gbps.
The GWS tests show that it is not only important to have a lot of spectrum. It is even more important to use it. Not only does the network have to be ready for it, but also the device. Most flagship devices are using the Qualcomm Snapdragon X55 modem. Devices using this modem, like the Samsung Note 20 that the GWS engineers used for the tests can utilize 8 channel CA in the mmWave band (> 6 GHz) with 2×2 MIMO and 200 MHz 4×4 MIMO below 6 GHz with 7×20 MHz channel CA for LTE. This means that when T-Mobile uses all its on average 130 MHz 2.5 GHz spectrum, current flagship devices will be ready. When Verizon and T-Mobile are ready to follow AT&T’s lead with 8 channel CA, the devices will also be able to support that. The Qualcomm X60 modem that’s for example in the Samsung Galaxy S20 can aggregate spectrum below and above 6 GHz. This allows to combine the better coverage characteristics of sub-6 GHz spectrum with the massive spectrum bands and therefore speeds that are available above 6 GHz. The X60 modem also works with the upcoming C-Band networks that will probably become available in 2022.
The bidding for licenses in the C-Band auction has ended with bids of $81 billion for 280 MHz, surprising most observers. The C-Band auction exceeded the previous record holder, the 2015 AWS-3 auction, which yielded $44.9 billion. While C-band raised almost twice as much as AWS-3, one of the things to consider is that different amounts of spectrum were for sale: 280 MHz in the C-Band auction versus 65 MHz in the AWS-3 auction. In terms of dollars per MHz of Population covered ($/MHz Pop), the metric by which we compare different amounts of spectrum and population coverage, the AWS-3 auction is still the most expensive auction in US history.
What are the drivers for spectrum prices? Looking at some of the most important auctions over the last 15 years gives us some important pointers, both when comparing prices within an auction and from auction to auction.
Auction
Year
MHz
Mhz
Result
$/MHz Pop
Notes
C-Band
2021
3700
280
$80.9b
$0.94
Unincumbered spectrum
CBRS
2020
3500
70
$4.6b
$0.22
Maximum 30 MHz & combined with unlicensed, limited power
600 MHz
2017
600
70
$19.6
$0.88
AT&T & Verizon mostly ineligible to bid
AWS-3 paired
2015
1700/2100
50
$42.5b
$2.71
Unincumbered spectrum
AWS-3 unpaired
2015
1700
15
$2.4b
$0.52
Unpaired spectrum
700 MHz B Block
2008
700
12
$9.06b
$2.24
Unincumbered spectrum
700 MHz A Block
2008
700
12
$3.87b
$1.17
Needed filters
700 MHz C Block
2008
700
22
$4.75b
$0.76
Net Neutrality
700 MHz E Block
2008
700
6
$1.26
$0.74
Unpaired spectrum
Conducted in 2008, the 700 MHz auction sold four different blocks of spectrum. A Block had significant interference issues because some broadcasters were still operating in the spectrum at that time and handsets required filters in order to work properly. However, none of the handsets in the time had those filters. The B Block was clean and ready to use spectrum. The C Block comes with net neutrality provisions attached to it because Google promised the FCC to bid on the spectrum. The FCC at the time was very eager to incentivize a new entrant into the US wireless market and the FCC interpreted from what Google had told them that Google would win the C Block auction and become a mobile network operator. Finally, E Block is a sliver of unpaired spectrum.
To no surprise B Block, the clean, ready to use spectrum, sold for the highest price. The problem A Block sold for half the price of the B Block. The C Block sold for one third of the A Block after Google bid once in the first round, Verizon topped it in the second round, and nobody else bid on it in the next 222 rounds of the auction. The smaller E Block of unpaired spectrum sold for a tiny bit less than the C Block because at the time, nobody really knew what to do with it as the technology to use it was not mainstream yet.
In the 2015 AWS-3 Auction, clean paired spectrum again sold for substantially more than unpaired spectrum. This time, it was more than five times the amount: $2.71 per MHz Pop compared to $0.52. Since the AWS-3 block laid next to the AWS-1 block which mobile operators had already deployed, it was very easy and cheap to use the spectrum without incurring infrastructure cost as the same equipment could be used. Basically, roughly the amount of the cost of the infrastructure went into the auction and drove up the price for the spectrum since operators calculate their total ownership cost of spectrum plus the cost to deploy in their budgeting process.
Prior to the 2017 600 MHz Broadcast Incentive Auction, T-Mobile and regional operators argued that AT&T and Verizon had too much low band spectrum in the market for others to be competitive, and therefore should not be allowed to bid on the 600 MHz auction. T-Mobile argued that it had no 700 MHz spectrum and therefore it was at a disadvantage, omitting that it chose at the time not to bid in the 700 MHz auction. Long story short, AT&T and Verizon were excluded from bidding on the vast majority of license. T-Mobile won more than half of the spectrum on bid for the auction (37 Mhz of 70 MHz) for one third of the price ($0.88 per MHz Pop) of what spectrum went for at the AWS-3 ($2.71 per MHz Pop) and 700 MHz ($2.24 per MHz Pop) auction since the regional operators did not have the financial resources to effectively compete with T-Mobile and Sprint chose not to participate.
Fast forward three years: T-Mobile buys Sprint for $26 billion. Sprint owned between 160 and 194 MHz of 2.5 GHz spectrum in the Top 100 markets with a nationwide average of 137 MHz plus 37 MHz in the 800 MHz, PCS, AWS bands and the Department of Justice and the FCC only require T-Mobile to divest 14 MHz of 800 MHz spectrum to Dish for $3.6 billion. Suddenly, T-Mobile has three times the low- and mid-band spectrum of Verizon and two times that of AT&T. Well played, T-Mobile, well played!
In 2020, the FCC auctioned off 70 MHz of 150 MHz CBRS spectrum. In the CBRS band, the 70 MHz CBRS auction winners could buy up to three 10 MHz Priority Access Licenses (PAL) and use them exclusively in addition to the 80 MHz General Authorized Access Licenses (GAA) licenses. Wherever PAL licenses were not sold, these licenses became GAA and could also be used by anyone. This novel approach of combining shared access with a licensing approach created an auction totaling $4.6 billion for the US Treasury or $0.22 per MHz Pop. This is by far the lowest amount per MHz Pop of all the auctions. One quarter of the 600 MHz Auction and one tenth of 700 MHz and one twelfth of the AWS-3 auction.
A few months after the CBRS auction concluded, the C-Band auction took place. The two spectrum bands are adjacent to each other and have identical propagation characteristics. The same spectrum at the same time could one lead to believe that the prices for the two bands would be very similar. The C-Band auction, which is clean, unincumbered spectrum yielded more than four times the price per MHz Pop than the CBRS Auction with its sharing characteristics. Furthermore, CBRS licenses were auctioned on a per county level whereas C-Band was auctioned on a Partial Economic Area basis, which are much larger.
Comparing the different prices, the following drivers of spectrum proceeds become obvious and should be considered by the FCC when designing upcoming spectrum auctions. After all, it’s the taxpayer’s money:
Exclusivity and larger license areas: Exclusive use in larger license areas has a 4x premium over shared use – C-Band versus CBRS (427%)
Clean spectrum: Cleared spectrum without incumbents sharing the spectrum is up to 2x as valuable – A Block versus 700 B Block (191%)
No bidder restrictions: Allowing everyone to participate in an auction increases spectrum value by up to 3x – AWS-3 paired versus 600 MHz (307%) or 700 MHz B Block versus 600 MHz (254%)
No restrictions on business models: Lack of business model restrictions increases spectrum value by 3x – 700 MHz B Block compared to 700 MHz C Block (294%)
Propagation characteristics: Unrestricted low band spectrum in 3x as valuable as mid band spectrum – AWS-3 paired compared to C-Band (288%)
Paired and unpaired spectrum no longer matters: The historic 3x difference between paired and unpaired spectrum does not have a technical reason anymore as 5G works better on unpaired spectrum.