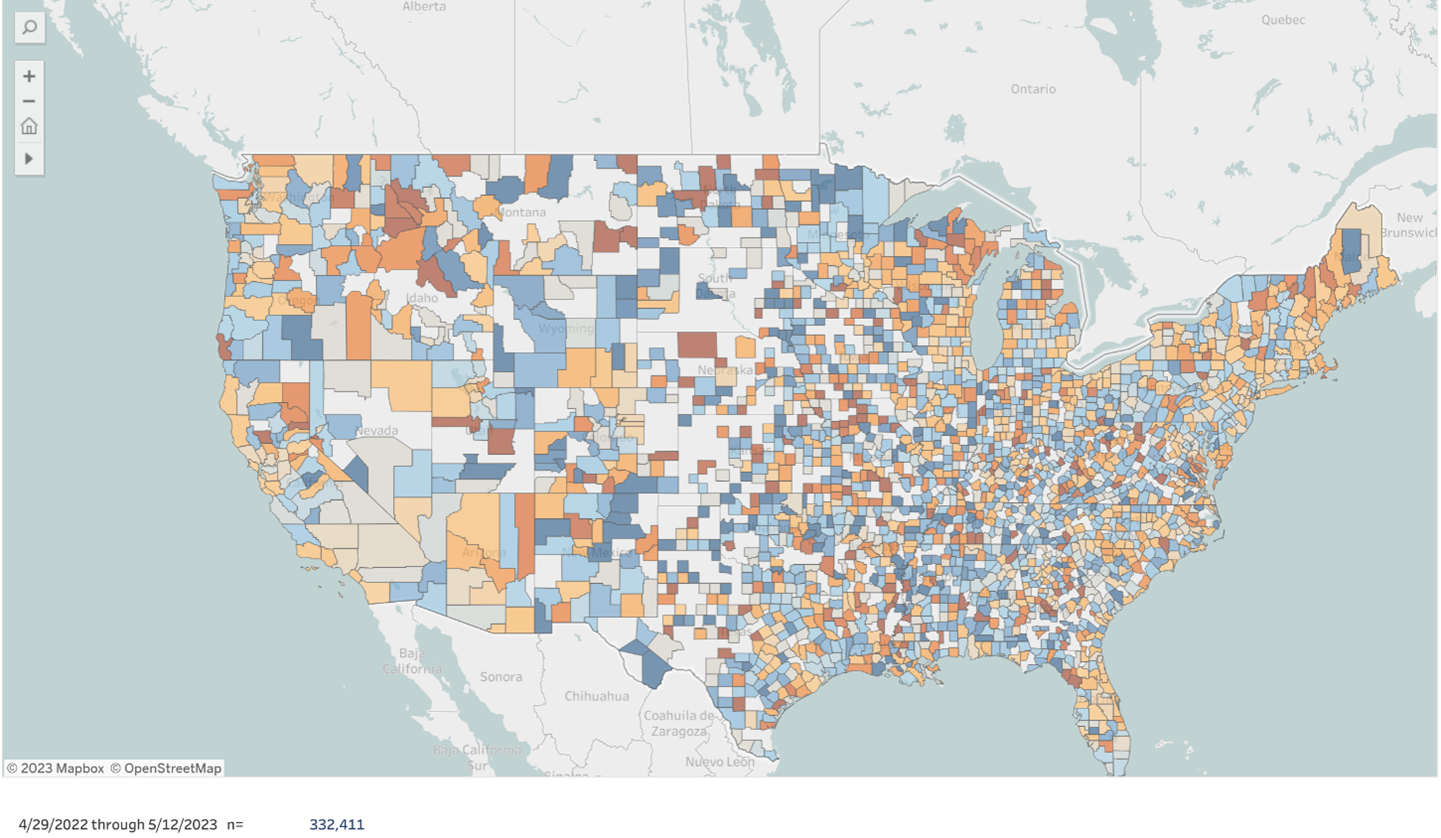
One of the key questions around the happiest and unhappiest home internet counties is where they are and what the driver is behind the happiness and unhappiness. Every week, we ask our respondents a battery of questions around how satisfied they are with the service they receive. After surveying more than three hundred and thirty thousand respondents later, we have respondents from 2,368 counties out of 3,142 in the United States telling us are telling us where the happiest and unhappiest broadband customers in the United States and allows us to determine the root cause behind their experience.

Questions that we aim to answer include: Why is home internet service in some places better than in others? Will the famous opening lines of Leo Tolstoy’s book Anna Karenina – “All happy families are alike; each unhappy family is unhappy in its own way” –  be applicable here? Are the larger observable trends, where fixed wireless NPS outperforms Fiber – which outperforms cable, which beats DSL and WISPs – be consistent in a granular county-by-county perspective? Does it matter if a county is in a blue state or a red state? Is the size of a provider any indication that the home internet customers in a county are happier or unhappier? Let’s just say that counties do not show the same behavior as Tolstoy’s families: it all comes down to local execution.

Let’s get politics out of the way first: Five of the ten unhappiest and five of the ten happiest counties are in states that are considered “Republican” and “Democratic”, respectively. Neither party’s approach to how they interact with home internet providers has had an impact on the distribution of the ten happiest and unhappiest counties.

Below is a map of the ten unhappiest home broadband counties in the United States with at least 100 respondents to ensure statistical veracity.

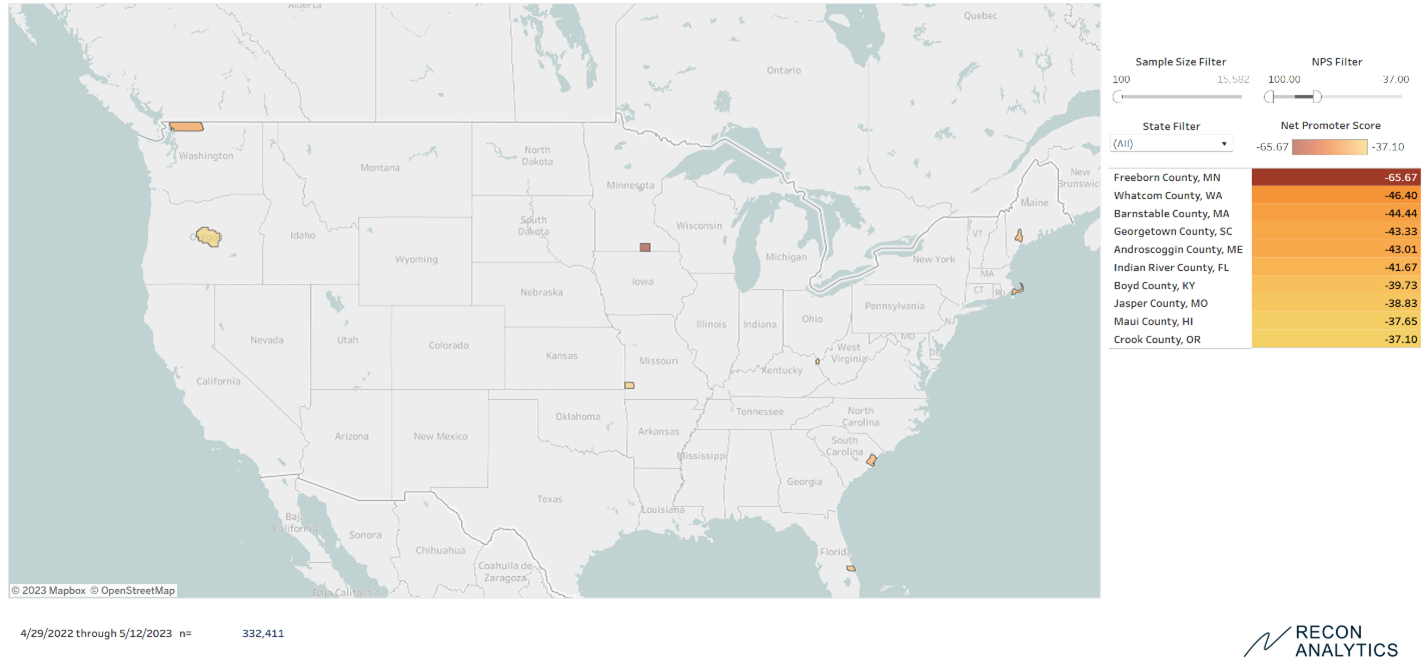
Interestingly, all the counties where the unhappiest home broadband customers are residing are rural counties with one exception: Indian River County, FL, the home of Vero Beach. This county, which is largely suburban, has the fourth highest concentration of millionaires on the United States. The population range per county is between 25,000 and 180,000 people. They are being served by between two providers in Barnstable County, MA and 14 providers in Jasper County, MO, which tells us that limited or significant choice is not a driver of unhappiness, especially when all of the counties are served by all technologies from fiber to DSL. Even if we controlled for coverage, we had some counties where there was fiber coverage in every ZIP-code (we did not check if every physical address was covered) like Georgetown County, South Carolina, Indian River County, FL, or Crook County, OR to where almost none of the ZIP-codes in a county, like Barnstable County, MA, were covered by fiber. These type of systemic, technology-driven or industry structural reasons are not providing the answer, despite being commonly accepted truths. In four of the ten unhappiest counties, membered own co-operatives which are typically non-profits were active.

We then looked at the happiest home broadband counties in the United States. The map confounds the expectations of many.

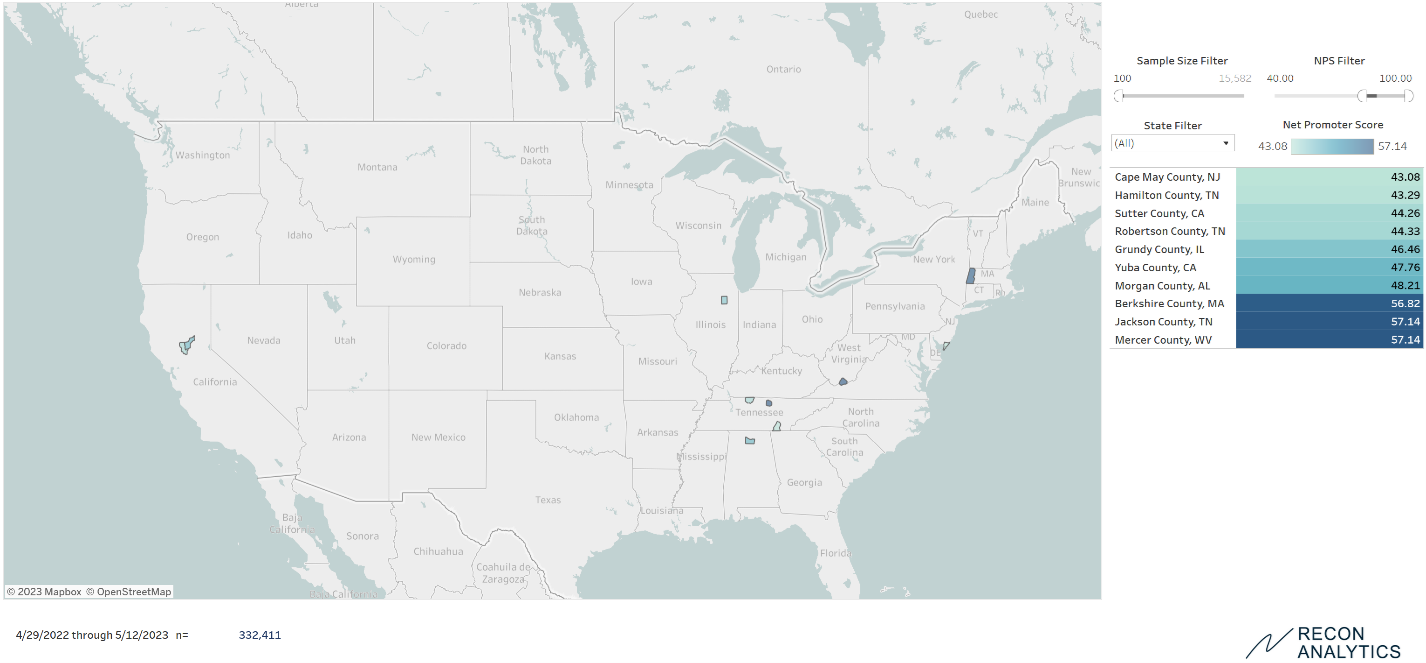
Who would have thought that four of the happiest broadband counties are in the rural South of Tennessee, Alabama and West Virginia? Nine of the ten happiest counties are rural. In six of the ten happiest counties, coops are active, but not in the happiest broadband county, Mercer County, WV. The poster child for municipal broadband, Chattanooga, TN, comes in as the 9th happiest home internet place in the country. The happiest county, Mercer County, WV does not have any coops providing telecom services there. In six of the happiest and four of the unhappiest broadband counties, coops are providing service. The mere presence of coops is providing better services, as the feedback we receive from customers ranges from terrific to terrible. Fiber or Cable coverage is also not playing a determining role.

The other fascinating insight is what is missing from the list: major urban markets. The idea that urban markets get all the investment because they are densely populated and cheaper to service, and therefore have the happiest broadband customers, is just not reflected in the data. At the same time, the rival argument that urban areas are dystopic wastelands with horrible broadband service is equally not supported by the data.

In the end, we found that what really matters is the individual performance of a provider in a given county. Below are the NPS scores for the providers with at least 20 respondents in each county where we had at least 100 respondents overall.

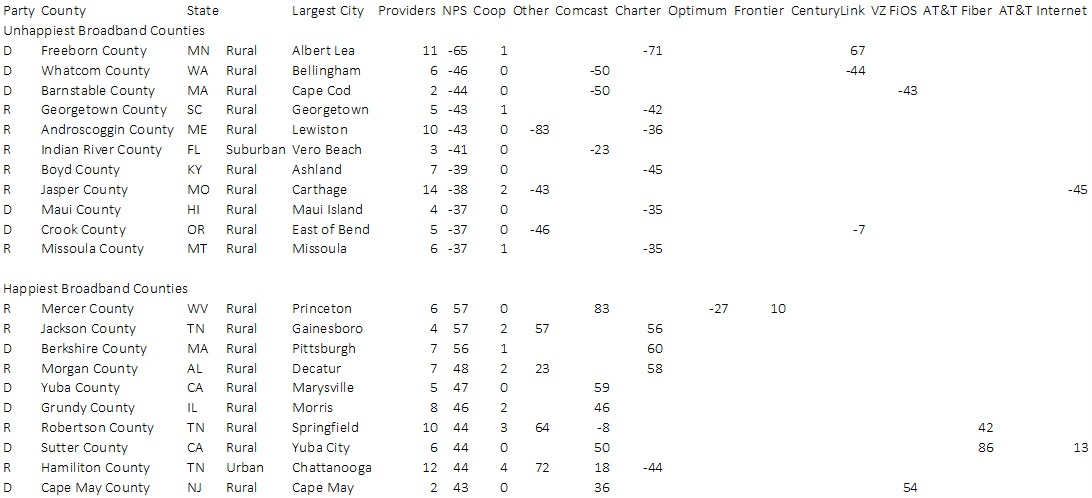
Almost all the providers displayed uneven performance. The same provider that performed very well in some counties performed poorly in others. Cable providers like Comcast and Charter performed very well in some counties. Comcast’s exceptionally good performance made Mercer County, WV the happiest broadband county. Equally, its poor performance in Barnstable County, MA and Whatcom County, WA made them the second and third unhappiest broadband counties. Only AT&T Fiber performed consistently well in the ten happiest counties and was not present in the unhappiest.

Additionally, 5G fixed wireless service did not make an impact on the happiest and unhappiest broadband counties. While in some of the counties there is 5G fixed wireless service, the adoption numbers were so low that they didn’t make an impact on the overall happiness of broadband customers.

Our research shows that every provider is able to do excellent work and make their customers happy. Considering that the nationwide providers engage in nationwide standard pricing, the satisfaction score differences are not driven by low price, but by actual performance. Technology helps, but the key is local execution.  Providers could improve their performance in markets by internally benchmarking their performance and extending best practices throughout the entire organization. Regulators should look at how satisfied the customers of applicants are before the allocate their broadband subsidies to expand services. If they have multiple applicants for subsidies, they should be given to the providers who deliver for the taxpayers, who provided the funds through taxes in the first place.

A new report called “Broadband 2020” by Recon Analytics shows that over 40% of employees in the United States are able to telecommute. The Department of Labor’s Bureau of Labor Statistics defines the professional workforce as all workers in the “management, professional, and related occupations” colloquially known as white collar workers, which make up 41.2% of all jobs in America. This means that basically every white collar worker is able to telecommute. This highlights the dramatic change that the American workplace has undergone during the pandemic.

The pandemic also has the potential to halt or even reverse the decades-long migration of Americans from rural to urban settings. A slight majority (50.9%) of Americans that can telecommute are contemplating moving to a smaller city or town as the pandemic has prompted many Americans to reevaluate their priorities and living conditions.

What is surprising is that even 31% of Americans that cannot telecommute are considering moving to a smaller city or town. It shows that the luster of metropolitan areas has been waning.

But not all new places are equal, so we asked what factors would stop people from moving to a new place. The results were equal parts predictable and surprising:

More than a third of Americans do not have any reasons that would prevent them from moving to a different place. Where it gets interesting is the reasons why people would not move. The number one reason for not moving to a different town or village is a pay cut – 31.6% of respondents. Companies like Facebook have announced that employees who work from home from lower-cost areas – and everything is lower cost than Silicon Valley – would receive a pay cut. A move that ties compensation to location rather than contribution would prevent a significant number of employees from moving away from Silicon Valley, which already is experiencing a severe housing shortage and overloaded roads. Facebook’s reasoning also allows a glimpse at its compensation philosophy, which seems to focus more on competitive factors than what is good for the community or the employee. Almost as many, 31%, would not move to a town or village without broadband, which is just ahead of access of quality health care with 30.1% – and that in the midst of a pandemic. One has to recognize the magnitude of this finding: Availability of broadband, access to quality healthcare, and a pay cut are equally important in the mind of Americans during a pandemic and recession.

At 36.3%, the 45-54 age segment considers the lack of broadband to be the most significant barrier to moving, followed by the 25-34 age segment with 35.8%. More than a quarter of seniors (26.1%) will not move to a new location if broadband isn’t readily available.

Broadband is even more important than politics. While 22.5% of Americans would not move to an area with what they consider an incompatible political climate, which is significantly less than the importance of broadband. The  45 to 56 age segment is most focused on  politics with over 30.9% citing an unwillingness to move due to an incompatible political climate. The next most polarized age segment is those over the age of 65, where 22.1% mention an incompatible political climate prevents them from moving.

The lack of a nearby airport or a buzzing nightlife was the least important in people’s minds. Only 13.7% of respondents thought that not having an airport within a 50-mile radius would prevent them from moving there. A buzzing nightlife or restaurant scene is even less on people’s minds. Only 9.6% of 18 to 24-year-olds find it an obstacle to move, whereas 13.1% of the 25 to 34 age segment needs a buzzing nightlife and restaurant scene.

We asked people what they considered broadband. The median American considers 50 Mbit/s download and 5 Mbit/s upload as broadband. The people’s expectations are leading the FCC’s definition of broadband which currently sits at 25 Mbit/s download and 3 Mbit/s upload.

The reason for this becomes apparent when we look at the use cases. In our survey we looked at several use cases, but the prevalence of video conferencing has driven bandwidth requirements upwards, especially on the upload side. A HD video stream requires a minimum of 5 Mbit/s upload and download per stream. With more than 25% of Americans now frequently using video conferencing for work and another 21% using sometimes for work the bar has effectively been raised.

While the lack of widely available broadband is a significant hurdle for cities and towns to attract new residents, it is almost outright disqualifying for housing options: 77.5% of respondents would not move to a place, like a house or apartment, that does not have broadband. This makes the availability of broadband one of the key selection criteria when choosing a new residence. When almost half of the population has to be sometimes or frequently on video conferencing, having broadband becomes a job requirement. The pandemic, for the good and bad, has made our homes places of work with the IT and connectivity needs that were traditionally reserved for places of work. These are just some of the highlights of the new Recon Analytics Report “Broadband 2020.”

The results of the report are reinforcing the data from FCC’s 2020 Broadband Deployment Report which represents the most recent government data on the topic and the progress the industry has made from 2014 to 2018.

As of 2018, 94.4% of the Americans have access to broadband as the FCC defines it, 25 Mbits download, 3 Mbits upload (25/3). In urban areas, it is even 98.5%, but as we look towards rural areas and tribal lands, the availability is significantly less. In rural areas 77.7% of Americans and in tribal lands, 72.3% of Americans have access to 25/3 broadband. In higher tiers, access in urban areas drops only slightly, but much more significantly in rural areas and in tribal lands. At the 250/25 Mbps tier, 94% of Americans in urban areas have access, a drop of 4.5% from the 25/3 level. In rural areas,  51.6% of American have access to 250/25, which is 26.1% less than 25/3. In tribal lands, 45.5% have access to 250/25 which is 26.8% less than 25/3.

The numbers make it clear that there is still more than enough to do in urban, rural and tribal areas to provide connectivity for essential tasks. As it looks increasingly unlikely that children in every school district will be able to go back to school, we need to ensure that every child in the United States can access the internet to be able to participate in school and classroom work. If only one child cannot participate, the progress and grades for the entire class are not counted. While fixed broadband deployment is a time-consuming endeavor, mobile broadband can and should close the homework gap. T-Mobile has announced that as part of its merger commitments it will deliver mobile broadband to 10 million households we have only a few weeks to turn this promise into a meaningful difference as the new school year starts. The other mobile operators, in conjunction with the FCC and federal funding, should seize the opportunity and close the homework gap as quickly as possible.

In order to recover as quickly as possible from the current economic slump, we should put money where it has the biggest impact. Different technologies are able to achieve the same goals but have strengths and weakness in different areas. This means that any funding has to be technologically agnostic and look at the performance characteristics. The United States has wisely always used performance characteristics such as download and upload speed as well as latency as its selection criteria rather than being tied to a technology regardless if it is fiber, hybrid fiber coax, VDSL, satellite or whatever generation of wireless standards.

If you would like to buy the underlying report, please give us a call at 617.823.3363