The wireless industry has a Walmart problem. Not because Walmart is hostile to carriers or OEMs, it’s quite the opposite. The problem is that Walmart has quietly become the single most important physical destination for wireless shopping in the United States, and no carrier directly controls what happens inside it. Many Walmart wireless departments operate through third-party firms like Premium Retail Services, OSL, and T-ROC, whose representatives work the floor under Walmart contracts rather than any carrier’s payroll. Carriers have contractual pathways into this model, but none have deployed them at the scale the foot traffic data now warrants.

According to new data from the Recon Analytics US Consumer Device Purchase Journey report series, which tracks more than 100,000 US respondents over five consecutive quarters from Q4 2024 through Q4 2025, Walmart Supercenter accounted for 17.4 percent of wireless store visits in Q2 2025. T-Mobile, the closest competitor, checked in at 16.1 percent. AT&T trailed at 12.8 percent. Verizon at 12.5 percent.

Let that sink in for a moment. A big-box retailer best known for groceries and $6 t-shirts is pulling more wireless foot traffic than the country’s most-subscribed carrier. And the people walking through those doors look nothing like the customers carriers typically design their promotions around.

The Prepaid Goldmine Nobody Owns

Half of Walmart’s wireless visitors, 50.8 percent, earn under $50,000 annually. That’s 4.7 points above T-Mobile stores, whose under-$25K visitor concentration already exceeds that of AT&T or Verizon. At the other big-box formats, Costco skews almost precisely the opposite direction: 19.6 percent of Costco wireless visitors come from the $100K–$149K bracket. These two stores are not serving the same customer, and treating big-box retail as a monolithic channel is a strategic error.

What makes Walmart particularly consequential is the prepaid concentration. Straight Talk and Tracfone together account for 9.9 percent of Walmart wireless visitors, three to five times the rate recorded at every other major retail location in the dataset. Factor in Cricket and Metro by T-Mobile, and nearly one in five Walmart wireless visitors currently carry a prepaid or MVNO plan. These are the exact consumers every major carrier wants to convert from prepaid to postpaid. They are clustered at a single, high-traffic physical location. And no carrier owns that location.

The table below shows how dramatically Walmart’s visitation share grew over six quarters, moving from statistical parity with T-Mobile in early 2024 to a clear lead by mid-2025.


Table 1: Store Visitation Rates by Quarter (% of Respondents), Q1 2024 – Q2 2025.

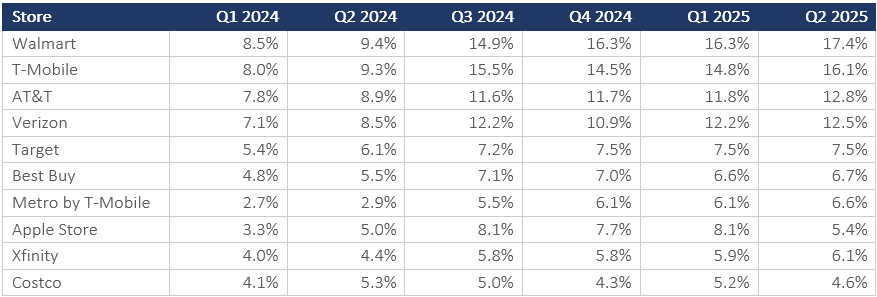
Source: Recon Analytics US Consumer Telecom Distribution Module Survey. Sample sizes range from 4,588 to 14,392.

The practical implication is direct: any carrier promotion designed to drive postpaid conversion needs to be built around households earning under $50,000 and being present in Walmart’s wireless section. However, in this income segment, the traditional credit-score-based approach for postpaid needs to be modified to mitigate credit-related risks. The research also identifies the offer threshold that motivates potential switchers. A free iPhone with trade-in activates 23 percent of potential switchers, nearly 10 percentage points above the equivalent Android offers. That sets a specific, high-cost floor for conversion economics that carriers cannot negotiate away.

Word of Mouth Is Still Running the Show

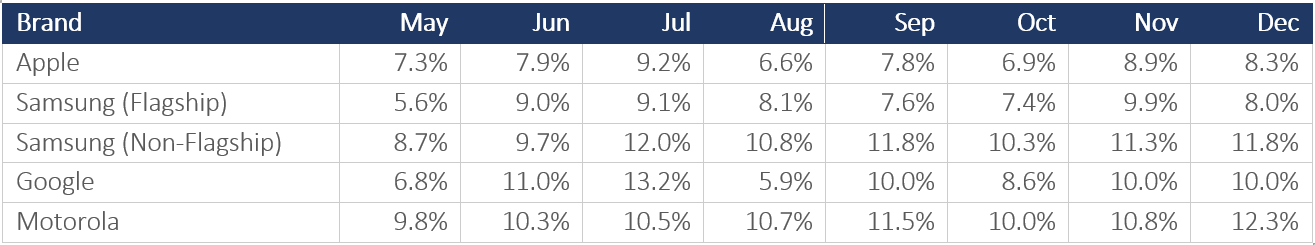
Before consumers walk into any store, they research. And there the industry’s assumptions break down in a different direction. Ask a carrier strategist where device research happens, and the answer usually involves something digital. The Recon Analytics data is more specific: friends and family recommendations are the top research sources for every brand, every month, across the full May through December 2025 tracking period. Not online reviews. Not manufacturers’ websites. Not AI. Word of mouth runs at 9.5–13.5 percent across all brand tiers, and it costs manufacturers precisely nothing to reach, because it operates entirely within their existing user base.

The seasonal patterns in the data are as instructive as the absolute levels. Apple’s word-of-mouth rate peaks in July, tracking the iPhone launch cycle almost perfectly. Motorola does the opposite; it peaks in December at 13.5 percent, the highest single-month reading among brands. When a brand’s strongest advocacy moment is gift season rather than device launch season, its buyer base skews toward casual acquirers rather than enthusiast adopters. That distinction matters for how a brand should allocate marketing expenses and which retail channels to prioritize.

The implication for brand equity is uncomfortable for Samsung, Google, and Motorola. Apple’s 71 percent installed-base penetration among 18-to-29-year-olds isn’t just a market-share statistic; it’s a word-of-mouth engine compounding with every person who joins the iOS ecosystem. Every satisfaction point (cNPS) Samsung, Google, or Motorola fails to recover is another recommendation that doesn’t get made. Brand satisfaction scores, often treated as a customer-retention metric, are the wireless industry’s most cost-effective marketing channel. Brands that let satisfaction erode are not just losing renewals, they’re defunding their own referral network.

AI Research Is Neither a Premium Behavior Nor a Young Person’s Game

The AI research channel is real, growing, and demographically inconvenient for anyone who assumed it was a luxury behavior.

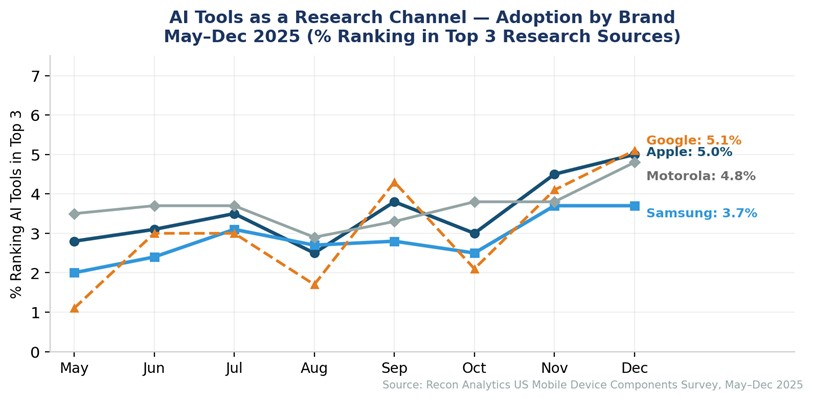
Among Apple buyers, usage of AI tools for device research climbed from 2.8 percent in May 2025 to 5.0 percent in December, a nearly 79 percent increase in eight months. Samsung’s AI research adoption also rose meaningfully, from 2.0 percent to 3.7 percent, while Motorola started the period at 3.5 percent, already above Samsung’s level throughout, and finished at 4.8 percent. That baseline anomaly is analytically significant. Motorola serves a demonstrably lower-income buyer base, yet its adoption of AI research led Samsung from the very first month. The data points to a specific use case: value-segment buyers using AI to navigate spec-to-price comparisons across a crowded $200–$400 Android mid-range market. That is a fundamentally different task from the premium ecosystem research OEM marketing teams typically assume AI serves.

Google’s trajectory requires a structural explanation, not a behavioral one. The apparent climb from 1.1 percent in May to 5.1 percent in December is real in aggregate, but it reflects two distinct product cycles layered atop one another. The June and July readings near 3.0 percent coincide with peak carrier promotional activity for the Pixel 9a. The August collapse to 1.7 percent reflects a research-intensity trough as that promotional window closed — visible simultaneously across friends-and-family, online reviews, and retail visits, not just AI. The December rebound to 5.1 percent is driven by Pixel 10 buyers entering the sample: those buyers use AI research tools at 8 to 11 percent, roughly four times the rate of Pixel 9a or legacy Pixel buyers. As Pixel 10 respondents grew from under 1 percent of the Google sample in August to 10 percent in December, they mechanically lifted the aggregate. Product-cycle awareness matters when reading these trends. A methodological note: Google’s monthly AI tool readings range from 6 to 51 respondents, which means individual monthly readings have wide confidence intervals, and the month-to-month pattern should be read as directional rather than precise.

Figure 1: AI Tools as a Research Channel — Adoption by Brand Tier, May–Dec 2025

The Research Phase Is Where Brands Are Won and Lost

The US Consumer Device Purchase Journey – Part 3 Report findings from Recon Analytics establish the precise mechanisms by which brands enter or exit consumer consideration sets before anyone walks into a store or opens a carrier website. And the picture that emerges is uncomfortable for anyone who has assumed the hard work of brand building happens in the channel.

The research phase is not a passive information-gathering exercise. It is where the consideration set forms and hardens. Consumers who rely primarily on friends and family, the plurality across every brand, are not conducting open-minded evaluations. They are asking people whom they trust whether to do what those people already did. For Apple, with 71 percent penetration among 18- to 29-year-olds, that dynamic creates an almost self-reinforcing competitive moat. Every iOS user is a potential advocate. Every cNPS point the brand sustains above its competitors is compounded through millions of peer conversations that no advertising budget can replicate or intercept.

For Android brands, the arithmetic runs the other way. Google’s word-of-mouth peaked in July at 13.9 percent, then collapsed to 5.7 percent in August, a swing of 8.2 points in a single month, consistent with the opening and closing of the Pixel 9a promotional window, though Google’s monthly sample sizes make single-month readings directional rather than precise. That kind of volatility, where it holds across larger samples, reveals a brand whose advocacy is promotional rather than organic. When the carrier offerings stop, the conversations stop. Samsung shows more structural stability in its word-of-mouth readings, but Apple’s dominant penetration among younger buyers, 71 percent among 18-to-29-year-olds per our previous report (US Consumer Device Purchase Journey – Part 1: Market Landscape, Brand Performance & Consumer Satisfaction – Digital Product Reports), suggests its advocacy engine is structurally deeper, compounding through a cohort that recommends devices to peers at the highest rate of any age group. The AI channel adds a new layer of complexity to this picture. Manufacturer websites are beginning to compete with AI-generated product comparisons for the consumer’s attention during the research phase. The brands that lose this competition are not losing a marginal channel. They are losing the moment when a consumer’s consideration set is still open. Amazon’s role as a neutral research environment, drawing 1.1 to 1.7 percent of cross-brand web traffic regardless of which device a consumer ultimately buys, illustrates the same principle: the early research phase is brand-agnostic terrain that favors whoever has the clearest, most accurate, and most findable product information.

The window is closing. Adoption curves tracked through December 2025 confirm that brands lacking structured, AI-indexed product data are already losing specification comparisons at the discovery stage — before a consumer ever sets foot in a store. This is not a risk to monitor in the future. It is a present one to act on.

Note: Data in this article is drawn from the Recon Analytics US Consumer Device Purchase Journey: Part 3, Pre-Purchase Research and Distribution Channel Dynamics. The series covers Q4 2024 through Q4 2025 using the Recon Analytics US Mobile Device Components Survey (n = 104,408 respondents across five quarters). If you are interested in the report, you can find it here: US Consumer Device Purchase Journey – Part 3: Pre-Purchase Research and Distribution Channel Dynamics

Device OEMs and carriers spent much of 2025 positioning AI as the defining reason to upgrade. On-device intelligence, Smarter cameras, Conversational assistants baked into the operating system. The marketing spending behind those messages was substantial. The consumer response, measured in actual purchase decisions, was not.

According to Recon Analytics’ US Consumer Device Purchase Journey — Part 2: Purchase Drivers and Feature Priorities, which tracked purchase behavior across more than 104,000 US respondents from May through December 2025, hardware failure was the single largest purchase driver for every brand tier in every single month of the tracking period. The range ran from 5.6 percent to 13.2 percent across brands, depending on the month. AI feature priority, by contrast, peaked at 5.1 percent for Motorola in December, with Samsung Non-Flagship nearly tied at 5.0 percent in the same month, while Apple and Samsung Flagship were at 4.5 percent and 2.8 percent, respectively. Performance and battery life combined accounted for 27 to 30 percent of feature selections throughout the period. The industry’s marketing story and consumers’ actual motivation have rarely been further apart.

Broken Phones Drive More Sales Than New Ones Do

The report’s most structurally important finding is also its simplest: new model launches do not generate demand. The ‘new model available’ driver accounted for just 1.1-4.6 percent of purchase decisions across brand tiers, the smallest driver in the entire dataset. Hardware failure drove purchases at rates typically two to six times higher across most brand-month combinations, with the gap widest among value-tier brands. Consumers replace devices primarily because their current one no longer functions, not because a shinier one arrived in a press release.

That distinction matters enormously for how carriers and OEMs plan their promotional calendars. Forced-replacement buyers cannot defer. They accept the best available offer when they need a device, not when a manufacturer wants them to buy one. Treating that demand pool as if it were promotion-responsive misreads its urgency structure, and likely leaves margin on the table.

Table 1.1: Device Stopped Working — Forced Replacement Cycle, May–Dec 2025

Source: Recon Analytics US Mobile Device Components Survey.

The data also reveals a counterintuitive finding about hardware quality that runs counter to the value-segment narrative. Budget devices do not just cost less; they wear out faster. As Table 1.1a shows, Motorola users hold their phones for an average of 1.88 years, the shortest tenure in the dataset, yet their average failure rate is 10.7 percent. Samsung Flagship users hold their devices for an average of 2.62 years, the longest tenure of any tracked brand, and register a failure rate of just 8.1 percent.

Table 1.1a: Estimated Average Device Tenure by Brand, Q4 2025

Source: Recon Analytics US Mobile Device Components Survey.

Premium hardware withstands extended ownership better than budget hardware, consistent with patterns observed throughout the study period. Apple users average 2.24 years of device tenure and register the lowest failure rate in the dataset at 7.9 percent, confirming that the tenure-failure inversion holds across both premium tiers. Motorola’s 9.2 percent fresh-acquisition rate, the highest among tracked brands, is not evidence of strong organic demand. It is the downstream consequence of a replacement cycle that restarts sooner due to the original hardware degrading faster. That is a structural ceiling on how much margin any promotional strategy can recover in the value segment.

The Carrier Calendar Runs the Market

If hardware failure drives those who replace their device, carrier promotional calendars drive when they do it. The seasonal signature for promotional offers—July peaks for back-to-school, August troughs as campaigns close, and November-December rebounds around Black Friday —appeared in lockstep across all five brand tiers tracked in the study: Apple, Samsung Flagship, Samsung Non-Flagship, Google/Pixel, and Motorola. Five tiers with entirely different products, price points, launch windows, and marketing strategies, all moving in the same seasonal rhythm.

The most parsimonious interpretation is that OEM launch timing does not govern purchase decisions at the market level. It is the carrier promotional calendar operating as a shared timing mechanism across the entire industry. OEMs that plan demand forecasts primarily around their own launch events are possibly treating a secondary driver as the primary one.

Software update obsolescence is the one driver that offers a genuine structural advantage to carriers and OEMs willing to exploit it. Running at roughly half the rate of hardware failure, 2.6 to 6.2 percent across the period, update-obsolescence buyers are the most forecastable pool in the market. End-of-support dates are published in advance. The affected device population is identifiable by model. The replacement decision, once support expires, is non-discretionary. Carriers with visibility into device models on their networks can reach those buyers three to six months before the end-of-support date, ahead of competitive search, with an offer calibrated to urgency. No other driver in the dataset offers that combination of predictability and addressability.

Google’s Numbers Tell a Different Story Than They Appear To

The Pixel data in this report is the most analytically complex and the most instructive for understanding how launch-dependent demand differs from organic demand.

Google’s purchase driver and feature priority metrics exhibit a consistent trough pattern in May and August, which appears in every table in the report. May’s lower readings reflect Pixel 9a launch dynamics: a-series buyers who purchased at general availability are newer-device holders with less accumulated hardware frustration and weaker brand motivation than the core Pixel base. Their inclusion in the May survey pool dilutes urgency metrics across the board. Google’s May failure rate of 6.8 percent and August reading of 5.9 percent are the two lowest in the Google series for exactly these reasons.

August is more complicated. The buyers who responded most urgently to July’s concentrated promotional activity had already converted by the time August surveys ran. Google’s July failure rate hit 13.2 percent, the highest reading for any brand in any month, as long-tenure Pixel 9-era holders reached their breaking point. Then it collapsed to 5.9 percent in August. The 95 percent confidence intervals for those two months, July [11.6%, 14.8%] and August [3.9%, 7.9%], are non-overlapping (z = -5.61), confirming that this is a compositional shift rather than sampling noise. On top of that, the Pixel 10 launched on August 28, meaning brand-motivated upgrade buyers were in a pre-purchase holding pattern for 28 of August’s 31 days. They showed up in September.

The result is that Google’s battery priority dropped by 9.9 percentage points from July to August, the largest confirmed metric swing across all ten feature categories in the dataset. Google’s brand reputation reading hit 2.9 percent in August, the series nadir, then recovered to 7.4 percent in December, the highest reading in the Google series and among the highest readings of any brand in any month during the study period. Both numbers are real. Neither is representative of Pixel’s underlying demand dynamics. Carriers and analysts reading Google’s monthly metrics without accounting for these structural troughs will systematically misread the brand’s actual competitive position.

What the Replacement Pipeline Looks Like Entering 2026

The demand picture for 2026 is governed less by any specific promotional campaign or AI feature rollout than by tenure and hardware degradation operating across a large installed base.

Samsung Flagship enters 2026 with 64.4 percent of its installed base in the two-plus-year upgrade window, the highest upgrade-eligible share of any brand, consistent with its 2.62-year average tenure. Apple’s 51.8 percent upgrade-eligible share, applied to its 55.9 percent installed-base share, produces the largest absolute pool of replacement-ready consumers in the market. Both pools are motivated primarily by performance and battery urgency, with carrier promotional offers providing the timing trigger rather than the underlying motivation.

Feature priorities tell a consistent story across the entire study period. Performance and battery lead every brand tier every month. Camera and storage form a durable secondary tier. AI feature priority, despite 12 months of industry marketing, remains below display quality and well below the hardware fundamentals that have driven replacement decisions for the better part of a decade. That gap may narrow as on-device AI capabilities mature and differentiate more visibly in daily use. Whether AI features will drive purchases in subsequent cycles as consumer familiarity grows is beyond the scope of this study, but nothing in the 2025 data suggests an inflection point is near. In 2025, according to the data, it had not narrowed yet.

The consumers replacing their phones in 2026 will mostly be doing it because something stopped working, or because a carrier made them a deal they could not ignore, or because their three-year-old Motorola finally gave up. This pipeline estimate assumes carrier promotional intensity and consumer credit conditions remain broadly consistent with 2025; a meaningful macro contraction or carrier subsidy reallocation toward broadband convergence rather than device promotions would compress conversion from the replacement-ready pool. The AI pitch may be the reason they choose one device over another at the moment of purchase. It is almost certainly not the reason they walked into the store.


Note: This report tracks completed purchase journeys. The survey captures US consumers who completed a device purchase during the study period. Consumers who considered upgrading but did not purchase are not represented in the data. The finding that AI features did not drive completed purchases is robust; whether AI features contributed to purchase deferrals cannot be determined from this dataset. This analysis covers US consumer purchases only. Enterprise procurement, trade-in program dynamics, and international markets are outside the scope of this dataset and may differ materially. Carrier-switching dynamics, including switching rates by brand tier and the role of competitive offers in driving net additions, are tracked separately and will be published in a forthcoming report in this series.

Recon Analytics’ US Consumer Device Purchase Journey report series, based on the Recon Analytics US Mobile Device Components Survey, covers more than 104,000 US respondents across five consecutive quarters from Q4 2024 through Q4 2025. You can find it here: US Consumer Device Purchase Journey – Part 2: Purchase Drivers and Feature Priorities

ANALYSIS | US SMARTPHONE MARKET

The US smartphone market loves good narratives. Apple versus Samsung. Premium versus value. Loyal fans versus deal-hungry switchers. A new deep dive from Recon Analytics, based on 104,408 US consumers tracked over five quarters, is here to complicate every one of those stories.

The headline is blunt: Apple ended 2025 with 55.9 percent of the US installed base, up 5.9 points in a single year. Samsung fell 4.9 points to 27.8 percent. The gap between the two brands, 28.1 points, is now 62 percent wider than it was twelve months ago. Five consecutive quarters of directional movement, with share gains accelerating rather than moderating, is consistent with a structural realignment rather than a cyclical fluctuation. The 2026 upgrade data will be the definitive test. The market share here is the installed base of over 104,000 US consumers, whose device information was passively collected during the survey. While we believe the data is robust, with a 0.3% margin of error (95% CI), the market share may still differ from the traditional shipments-based market share. The quarterly market-share trends based on the installed base provide a more directional analysis of the market than an absolute one.

Table 1.1: Quarterly Market Share Trends (% of Installed Base)

Note: *Others include OnePlus, LG, TCL, Xiaomi, Nokia, BLU, and remaining brands. Source: Recon Analytics US Mobile Device Components survey, Q4 2024–Q4 2025.

The Ecosystem Trap Nobody Can Escape

Apple is not winning on specs. The iPhone 17 series ships with a smaller battery than leading Android rivals. Its camera array does not top the industry benchmarks. What Apple has built instead is a gravitational field: iMessage, AirDrop, FaceTime, and the seamless handoff between iPhone, iPad, Mac, and Watch. Switching away from Apple does not just mean buying a new phone; it means abandoning a digital life. No hardware specification can compete against that.

The data confirms what Apple’s own marketing has long implied: its best salesperson is a current iPhone user. Friends and family recommendations ranked as the top research source for Apple buyers every single month across the May–December 2025 tracking period. No paid media budget can replicate a word-of-mouth engine that runs entirely within an installed base of 150 million-plus American consumers.

Samsung’s Two-Brand Problem

Here is the part of the Samsung story that most competitive analyses get wrong: there is no single Samsung. There are two, and blending them together produces numbers that are wrong for both.

Samsung Flagship, the Galaxy S, Z Fold, and Z Flip series, averaged $1,056 per device in Q4 2025 (Recon Analytics US Mobile Device Components survey, Q4 2024 – Q5 2025). That is $69 above Apple’s average of $987. Samsung’s premium users are paying more than iPhone users. The Galaxy S and Ultra command high customer satisfaction, with a flagship satisfaction score (cNPS) of 32.4 (n=37,302, May-Dec 2025), compared to Apple’s 30.4 (n=107,406, May-Dec 2025). Note: the 2.0-point gap between these scores sits at the cNPS noise threshold; confirm subgroup-level margin of error before asserting a directional lead. The component net promoter score (cNPS) is Recon Analytics’ proprietary version of the NPS. Recon Analytics’ cNPS covers smartphones from 22 dimensions. Also, 64.4 percent of the Samsung flagship installed base is now in the 2-plus-year upgrade-eligible window. That is the most financially concentrated upgrade opportunity in Android heading into 2026.

Then there is Samsung Non-Flagship, the Galaxy A-series, averaging $243 per device in Q4 2025, down sharply from $316 a year ago (Recon Analytics US Mobile Device Components survey, Q4 2024–Q4 2025). Its satisfaction score (cNPS) sits at 22.3, with 26.9 percent of users actively detracting from the brand. The A-series does not just underperform; it creates potential brand-perception drag that shadows every Samsung consumer evaluation. The $813 gap between Samsung’s two tiers is the starkest within-brand pricing divide in the market.

The consideration data makes the structural problem concrete. Samsung Non-Flagship buyers cross-shop Apple at a higher rate than Samsung Flagship buyers, 23.1 percent versus 20.5 percent (Recon Analytics US Mobile Device Components survey, May-Dec 2025; Samsung Non-Flagship, n= 32,263, and Flagship n=37,302 respectively), and that gap widened through the second half of 2025. Whether this reflects an aspirational pull toward Apple specifically or the generally higher brand fluidity among value-tier buyers is a distinction the consideration data raises but does not fully resolve; both mechanisms likely contribute.

Google Ran an Experiment. The Results Were Not Encouraging.

Google’s 2025 is a case study in the difference between rented share and owned share. Pixel climbed from 2.6 percent of the US installed base in Q4 2024 to 5.3 percent in Q3 2025, driven by carrier promotions and the launch of the Pixel 10. By Q4 2025, it was back at exactly 2.6 percent. Exactly where it started. The precision of that reversion is striking.

The hardware was not the problem. Google Pixel Pro earned the highest device-level satisfaction score (cNPS) in the entire dataset, 33.2 cNPS, with the lowest detractor rate among all flagship-tier devices. The product genuinely converts buyers into advocates. The challenge is that Pixel advocacy operates largely outside the physical environment where most purchase decisions are finalized. Pixel devices appear on carrier websites, but are underrepresented in the physical store, according to Recon Analytics’ survey data (see upcoming Consumer Device Purchase Journey – Part 3 report), 53 to 55 percent of US device sales through carrier and big-box channels are driven by in-store staff recommendations, floor placement, and promotional subsidies — not web listings. A phone can be available online and still be invisible at the point of conversion. That is Google’s distribution problem: not absence from the catalog, but absence from the moment that matters.

Google’s 2025 trajectory is the reference point every brand strategist in this market should keep close to. A promotion without a plan for what happens when it ends is a subsidy, not a growth strategy.

Motorola Does Not Get Enough Credit

While the industry fixates on the premium tier, Motorola has quietly done something harder than it looks: hold ground. The brand maintained 11.0 to 11.4 percent share across all five tracked quarters, with a consistent Q4 seasonal lift driven by holiday gift purchases. Its average device price runs around $313 to $333, flat across the year, with no pretensions toward premiumization. Motorola’s franchise is built on carrier placement and price discipline, and it executes that positioning with a consistency that belies its unglamorous reputation.

The satisfaction picture is mixed: non-flagship CNPS at 20.7 (cNPS), with 28.6 percent detractors, suggests elevated hardware quality friction at the low end, but the brand’s structural stability in a year when Samsung shed nearly 5 points is nothing.

The Upgrade Pipeline That Will Define 2026

Here is the question that makes 2025’s data genuinely consequential: what happens to the upgrade cycle next year?

Apple’s 51.9 percent upgrade-eligible rate, applied to its dominant installed base, produces the largest absolute pool of upgrade-ready consumers in the market. Samsung Flagship’s 64.4 percent eligible rate, though applied to a smaller base, represents the single most financially concentrated upgrade opportunity in Android. The two pools together define the 2026 replacement market.

Samsung’s most immediate strategic decision is whether it converts that aging flagship base before Apple does. Galaxy S users are holding devices longer than any other tracked segment and are currently cross-shopping Pixel as their primary Android reference point rather than iPhone. That is a narrower competitive window than most Samsung strategists probably assume. If Samsung can capture the upgrade cycle with its own flagship base, the share-loss story changes. If Apple absorbs another wave of premium converts, the 28-point gap could widen further.

The data does not predict outcomes. But it tells you exactly where the pressure points are, which side has the momentum, and which brand’s growth is real. Right now, Apple has the momentum. Google has the product but not the shelf. Samsung has two businesses that need two strategies. And Motorola has quietly survived a year that was much rougher than the headline numbers suggest.

The 2026 upgrade cycle is loaded. Whoever takes it may well determine whether this is a structural realignment or a temporary gap. The thesis that this is a structural shift, not a cycle, has three observable tests. First: if Samsung Galaxy S26 captures more than 55 percent of its own upgrade-eligible base in Q1-Q2 2026, the share-loss momentum is arrestable. Second: if Apple’s installed base reaches 58 percent by Q2 2026, the shift is accelerating past Samsung’s realistic recovery window. Third: if Google’s share holds above 3.5 percent through Q2 2026 without a promotional event, it has converted rented share into owned share for the first time. Any one of these outcomes materially changes the 2026 forecast.

Note: This analysis covers the US smartphone installed base from Q4 2024 through Q4 2025. It does not address global market dynamics where Samsung’s competitive position differs materially; carrier incentive structures that drive short-term share movements independent of brand preference; or price elasticity effects that may account for some portion of Apple’s installed base growth. These variables are available for analysis in subsequent phases of the device-purchase-journey study. If you want to find out more about the Recon Analytics’ US Consumer Device Purchase Journey Part 1: Market Landscape, Brand Performance & Consumer Satisfaction report, which is based on 104,408 US respondents tracked from Q4 2024 through Q4 2025, please visit here: US Consumer Device Purchase Journey – Part 1: Market Landscape, Brand Performance & Consumer Satisfaction – Digital Product Reports

RECON ANALYTICS ACQUIRES ATOM INSIGHTS, EXPANDING GLOBAL DEVICE INTELLIGENCE

Boston, MA and Montreal, Canada — March 16, 2026 — Recon Analytics has acquired Atom Insights, a device market intelligence firm with operations in Canada and India. Terms were not disclosed.

Hanish Bhatia, Founder of Atom Insights, joins Recon Analytics as Vice President of Device Intelligence. Bhatia previously served as Associate Director at Counterpoint Research, where he covered global smartphone and device markets for seven years. All employees of Recon Analytics Canada, Recon’s U.S.-based device intelligence group, and its India operations will report to Bhatia.

The acquisition integrates Atom Insights’ global device shipment, sell-through, and component-level intelligence into Recon’s customer research platform, creating the industry’s first end-to-end intelligence service from silicon to subscriber sentiment. Atom Insights tracks device sell-through at the model level across 40-plus countries, covering 400-plus device OEMs and 25-plus semiconductor vendors across smartphones, tablets, wearables and PCs.

“We have spent four years building the customer insights infrastructure that the U.S. telecommunications industry runs on. We built this platform deliberately, like a puzzle, with a connector piece already designed for exactly this moment. We can measure what subscribers experience across 22 dimensions of satisfaction matched to their specific handset hardware, and we know what is inside those devices. What we needed was someone who could tell us how many of them shipped, through which channels, and across which markets. Atom Insights and Hanish Bhatia are the piece we built the that connector for,” said Roger Entner, Analyst and Founder of Recon Analytics.

“Recon is the only firm that can show how a specific handset performs on customer satisfaction matched to real hardware IDs, and tell clients what to do about it,” said Bhatia. “Combining that with Atom Insights’ supply-side data creates a device analytics capability that does not exist anywhere else.”

“Atom Insights lets us answer which device configurations drive satisfaction, which component choices create churn risk, and how OEM decisions ripple through carrier economics,” said Brett Clark, Analyst and COO of Recon Analytics.

Atom Insights’ device intelligence integrates alongside Recon’s Pulse service, on which the largest U.S. telecommunications companies rely for competitive decision-making. Pulse fields more than 15,000 U.S. telecom consumers and up to 1,200 telecom businesses weekly in English and Spanish. Beyond telecom, Pulse reaches 6,000 consumer and business AI respondents, the largest AI customer insights service in the world, and up to 6,000 airline travelers weekly.

Atom Insights’ data will also be available across all three tiers of Recon’s AI platform: Ghost Lab for outside-the-firewall analytics across Recon’s insights and 150-plus third-party databases including speed test data, spectrum data as well as government databases; Recon Enclave deployed inside the client’s firewall; and the Reconnaissance Platform, Recon’s autonomous intelligence system for scenario simulation and decision-ready recommendations.

“The analytical frameworks we have built over four years transfer across industries and geographies,” said Entner. “The device value chain is the natural next frontier, and we intend to keep building.”

About Recon Analytics

Recon Analytics is the largest telecom operator-centric market research provider in the United States, with active verticals spanning AI consumer behavior and commercial aviation. The firm’s dataset includes almost a million device-matched respondents and a historical repository of 2 million-plus total respondents. Our Pulse service delivers near real-time customer insights on a weekly basis answering the specific questions our clients are looking for. Recon delivers intelligence through a three-tier AI architecture: Ghost Lab, Recon Enclave, and the Reconnaissance Platform. www.reconanalytics.com


About Atom Insights

Atom Insights provides model-level device sell-through, shipment tracking, semiconductor market analysis across 40-plus countries and 400-plus OEMs. www.atom-insights.com

Media Contact

Sarah Leggett | [email protected]

The launch of a new iPhone is still the most significant event in the wireless year. When consumers prepare to get their next iPhone, they are also undertaking a major financial decision and are often using that opportunity to evaluate new mobile service provider options. The different wireless carriers are engaging in different strategies for retaining and attracting customers who are getting a new iPhone. AT&T is offering the same deals for new and existing customers with almost every plan. T-Mobile requires customers to either add a line, upgrade their plan or be on their most expensive plan. Verizon is targeting only their best customers and new customers with the best offers.

The results are telling: AT&T’s John Stankey said during AT&T’s Q3 earnings call that AT&T “saw the strongest iPhone preorders we’ve had in many years.” Meanwhile, Verizon’s Hans Vestberg said during Verizon’s Q3 earnings call that “we continue to see muted upgrade levels.” T-Mobile’s Mike Sievert said customers don’t feel they need to take advantage of the device upgrades.

We can see in near real time how the respective carrier strategies materialize in the marketplace. We collected around 30,000 respondents between the iPhone 15 launch and last weekend, giving us faster and more in-depth data on what is happening than anyone else. Based on our data ending, 10/22/23 AT&T has the most iPhone 15 upgrades of any carrier despite being the smallest of the nationwide mobile network operators (MNO). Followed by T-Mobile, who had the lowest upgrade rate in the industry but it’s iPhone sales were buoyed by the highest net adds. They were trailed by Verizon, who is the largest MNO, with the second lowest upgrade rate and the lowest net adds. As one would expect, Xfinity and Spectrum are trailing the MNOs as they are offering significantly less generous device promotions.

iPhone Model Distribution by Carrier
Mobile Make ModelAT&TT-MobileVerizonXfinity / ComcastSpectrum / CharterOtherTotal
iPhone 153%4%6%<1%1%1%16%
iPhone 15 Plus3%1%3%<1%<1%<1%8%
iPhone 15 Pro11%10%8%2%<1%1%33%
iPhone 15 Pro Max15%14%10%1%1%2%43%
Total33%29%27%4%3%5%100%
Source: Recon Analytics Device Pulse   

The premium iPhone is becoming a super-premium product. We can see this with the heavy skew towards the iPhone 15 Pro and Pro Max, Apple’s most premium products. More than three quarters of all iPhone 15s are the two premium versions of the iPhone, with the Pro Max outselling the Pro. This shows the pricing power that Apple possesses as the cheapest iPhone 15 Pro Max was $100 more expensive than the iPhone 14 Pro Max but received a storage upgrade.

In recent years, the FTC raised concerns that Qualcomm’s patent portfolio and unbiased licensing scheme would prevent other companies from manufacturing and selling 5G chipsets, leading to an anti-trust lawsuit that concluded in November 2019. However, the prediction has not borne out. Currently, there are two companies, Qualcomm and MediaTek, that sell 5G chipsets to the device ecosphere at large, two captive suppliers who make their own 5G chipsets for internal consumption, and one company that is creating its own new 5G chipset also for internal consumption.

The mobile chipset business has a series of players with different objectives. Companies like Qualcomm and MediaTek provide mobile chipsets to device manufacturers and serve the vital function of ecosphere enablers. Without them, the plethora of devices and choices consumers enjoy when it comes to smartphones would not be possible. Another set of companies are making mobile chipsets only for themselves to create a competitive advantage in the marketplace. Apple and Samsung fall into this camp. Huawei is potentially a hybrid case as it was previously only providing its own handset group with chipsets, but now also provides them to a Chinese state-led consortium that purchased the Honor handset line.

 CustomerModemIntegrated SoCStand-alone Application ProcessorRF Frontend
QualcommEcosphereYesYesNoYes
MediaTekEcosphereNoYesNoNo
HuaweiDivested divisionsYesYesDiscontinuedNo
SamsungCaptiveYesYesNoNo
AppleCaptiveFutureFutureYesNo
Intel
(sold to Apple)
EcosphereYesNoAbortedNo

Currently, Qualcomm provides high-quality Systems on Chip (SOC) that are integrating multiple components, ranging from baseband, AI, graphics, camera, to CPU into one chip to anyone interested in them. Qualcomm was the first company to offer 5G chipsets with the first devices hitting the market at the end of 2019. MediaTek is offering a similar, but less advanced and less integrated product line to device manufacturers looking for low-level to medium-level chipsets. By the middle of 2020, MediaTek’s chipsets were powering a broad portfolio of handsets.

Intel, another ecosphere provider, sold its mobile chip business to Apple in December 2019, nine years after it entered the mobile chip market by buying a division of Infineon. Intel’s motivation to buy Infineon was that Infineon was the sole provider of modems to Apple. Reportedly during the negotiations between Intel and Infineon, then-Intel CEO Otellini sought reassurances from then-Apple CEO Steve Jobs that Apple would continue to use Infineon products after the Intel acquisition as Otellini recognized the importance of Apple as a customer for its chipsets. During the nine years after the Infineon acquisition, Intel’s mobile chipset division’s fate was intricately linked to Apple as Intel struggled to find other customers in the mobile device manufacturer ecosphere. In a nutshell, Intel was unable to compete with Qualcomm on quality like RF performance and SoC integration and was unwilling to compete with MediaTek as it had a more integrated solution and Intel did not. Intel ultimately threw in the towel on the heels of Apple and Qualcomm settling their lawsuit and agreeing to a six-plus two-year licensing and multiyear chipset supply agreement.

Huawei through its HiSilicon subsidiary has developed and used its own 5G chipsets and has integrated them into its own devices. While the Huawei chipsets are not as integrated and small as Qualcomm’s, Huawei’s engineers have found ways to integrate the chipsets into its devices. It is using Qualcomm, Skyworks and Qorvo, all from the US, for its RF front-end. Huawei’s role in the mobile world got a lot more interesting as it has sold its Honor-brand device division to a Chinese state-led consortium of more than three dozen companies as Huawei experienced a lot of pressure on its devices sales due to American sanctions. Reportedly, Huawei is also considering selling its Mate and P-line device groups in the hope that American sanctions will not follow to the new owners of the device businesses. Up until now, Huawei is not selling its HiSilicon chipsets to other companies, other than the group of Huawei dealers that acquired the Honor-brand device division, as a competitive weapon in order to keep their best technology capitive. In 2019, during the trade tensions between the US and China over Huawei, the company offered to license its 5G intellectual property to American companies to alleviate any spying concerns, but no deal has emerged until to date. If Huawei is divesting its entire device portfolio Huawei might either also divest its HiSilicon division with it or become an ecosphere provider for other handset manufacturers. The direction of Huawei’s HiSilicon business will be quite telling of the size of the Chinese walls between Huawei and its divested handset businesses as well as other handset vendors.

Samsung has been producing its own Exynos modems and mobile processors, and has also purchased mobile chipsets from Qualcomm. Samsung’s new 5G devices, including its S20 5G flagship smartphone, is shipping either with the Exynos or Qualcomm Snapdragon chipset. Samsung sells the Qualcomm variant in the US, China, and most recently South Korea, and its Exynos variant in the rest of the world. Benchmarking has shown that the Qualcomm chipset version regularly outperform the Exynos one and that Samsung uses the Qualcomm variant in the most competitive markets to close the gap against Apple’s iPhone.

In 2008, Apple with its computer heritage bought P.A. Semi, a processor development company specializing in highly power-efficient designs, to build its own ARM-based processors for iPhones, iPads, and similar devices. Apple’s ARM processors are now the fastest CPUs in the market and will start powering Apple Mac computers starting in 2021. Apple sourced its baseband chipset first from Infineon, then post-acquisition from Intel, then a few years later from Qualcomm, then dual-sourced from Intel and Qualcomm, and most recently in 2019, signed an agreement to return to Qualcomm. In 2019, Apple also bought Intel’s baseband chipset business and has started hiring more wireless engineers in San Diego, Qualcomm’s home market. Considering Apple’s track record it is quite logical that Apple is going to try to replicate its successful ARM processor endeavor in modems, and internally source its 5G mobile chipsets when the Qualcomm agreement expires. The Qualcomm agreement gives Apple breathing room to pour its resources into an area that is a key differentiator between mobile devices.

These successful 5G chipset endeavors demonstrate that Qualcomm’s patent portfolio and licensing policy do not present a significant barrier to innovation. Qualcomm’s licensing rates have not changed since it first started licensing CDMA in the 1990s, while its portfolio has grown substantially, facilitating continued innovation that has made the United States a leader in international telecommunications on a fair, reasonable, and non-discriminatory basis. As silicon merchants to the industry, Qualcomm and Mediatek’s participation in chipset development creates choice and opportunity for many mobile device manufacturers to have a chipset that meets their needs and budgets exponentially increases the range of consumer choices without infringing on the ability of other companies to enter the market.

When Nvidia announced that it was in the process of buying Arm from Softbank, many analysts and industry observers were exuberant about how it would transform the semiconductor industry by combining the leading data center Artificial Intelligence (AI) CPU company with the leading device AI processor architecture company. While some see the potential advantages that Nvidia would gain by owning ARM, it is also important to look at the risks that the merger poses for the ecosphere at large and the course of innovation.

An understanding of the particular business model and its interplay highlights the importance of the proposed merger. Nvidia became the industry leader in data center AI almost by accident. Nvidia became the largest graphics provider by combining strong hardware with frequently updated software drivers. Unlike its competitors, Nvidia’s drivers constantly improved not only the newest graphics cards but also past generation graphics cards with new drivers that made the graphics cards faster. This extended the useful life of graphics cards but, more importantly, it also created a superior value proposition and, therefore, customer loyalty. The software also added flexibility as Nvidia realized that the same application that makes graphics processing on PCs efficient and powerful – parallel processing – is also suitable for other heavy computing workloads like bitcoin mining and AI tasks. This opened up a large new market as its competitors could not follow due to the lack of suitable software capabilities. This made Nvidia the market leader in both PC graphics cards and data center AI computation with the same underlying hardware and software. Nvidia further expanded its lead by adding an parallel computing platform and application programming interface (API) to its graphics cards that has laid the foundation for Nvidia’s strong performance and leading market share in AI.

ARM, on the other hand, does not sell hardware or software. Rather, it licenses its ARM intellectual property to chip manufacturers, who then build processors based on the designs. ARM is so successful that virtually all mobile devices use ARM-based CPUs. Apple, which has used ARM-based processors in the iPhone since inception is now also switching their computer processors from Intel to ARM-based internally built CPUs. The ARM processor designs are now so capable and focused on low power usage that they have become a credible threat to Intel, AMD, and Via Technology’s x86-based CPUs. Apple’s move to eliminate x86 architecture from their SKUs is a watershed moment, in that solves a platform development issue by allowing developers to natively design data center apps on their Macs. Consequently, it is only a matter of time before ARM processor designs show up in data centers.

This inevitability highlights one of the major differences between ARM and Nvidia’s business model. ARM makes money by creating processor designs and selling them to as many companies that want to build processors as possible. Nvidia’s business model, on the other hand, is to create its own processor designs, turn them into hardware, and then sell an integrated solution to its customers. It is hard to overstate how diametrically different the business models are and hard to imagine how one could reconcile these two business models in the same company.

Currently, device AI and data center AI are innovating and competing around what kind of tasks are computed and whether the work is done on the device or at the data center or both. This type of innovative competition is the prerequisite for positive long-term outcomes as the marketplace decides what is the best distribution of effort and which technology should win out. With this competition in full swing, it is hard to see how a company CEO can reconcile this battle of the business models within a company. Even more so, the idea that one division of the New Nvidia, ARM, could sell to Nvidia’s competitors, for example, in the datacenter or automotive industry and make them more competitive is just not credible, especially for such a vigorous competitor as Nvidia. It would also not be palatable to shareholders for long. The concept of neutrality that is core to ARM’s business would go straight out of the window. Nvidia wouldn’t even have to be overt about it. The company could tip the scales of innovation towards the core data center AI business by simply underinvesting in the ARM business, or in industries it chooses to deprioritize in favor of the datacenter. It would also be extremely difficult to prove what would be underinvesting when Nvidia simply maintained current R&D spend rather than increasing it, as another owner might do as they see the AI business as a significant growth opportunity rather than a threat as Nvidia might see it.

It is hard to overestimate the importance of ARM to mobile devices and increasingly to general purpose computing – with more than 130 billion processors made as of the end of 2019. If ARM is somehow impeded from freely innovating as it has, the pace of global innovation could very well slow down. The insidious thing about such an innovative slow down would be that it would be hard to quantify and impossible to rectify.

The proposed acquisition of ARM by Nvidia also comes at a time of heightened anti-trust activity. Attorney Generals of several states have accused Facebook of predatory conduct. New York Attorney General Letitia James said that Facebook used its market position “to crush smaller rivals and snuff out competition, all at the expense of everyday users.” The type of anti-competitive conduct that was cited as basis for the anti-trust lawsuit against Facebook was also that of predatory acquisitions to lessen the threat of competitive pressure by innovative companies that might become a threat to the core business of Facebook.

The parallels are eerie and plain to see. The acquisition of ARM by Nvidia is all too similar to Facebook’s acquisitions of Instagram and WhatsApp in that both allow the purchasing entity to hedge their growth strategy regardless of customer preferences while potentially stifling innovation. And while Facebook was in the driver’s seat, it could take advantage of customer preferences. Whereas in some countries and customer segments the core Facebook brand is seen as uncool and old, Instagram is seen as novel and different than Facebook. From Facebook’s perspective, the strategy keeps the customer in-house.

The new focus by both States and the federal government, Republicans and Democrats alike, on potentially innovation-inhibiting acquisitions, highlighted by their lawsuits looking at past acquisitions as in Facebook’s and Google’s case, make it inevitable that new mergers will receive the same scrutiny. It is likely that regulators will come to the conclusion that the proposed acquisition of ARM by Nvidia looks and feels like an act that is meant to take control of the engine that fuels the most credible competitors to Nvidia’s core business just as it and its customers expands into the AI segment and are becoming likely threats to Nvidia. In a different time, regardless of administration, this merger would have been waved through, but it would be surprising if that would be the case in 2021 or 2022.

Stay-at-home orders, school closings, and social distancing have raised the issue of the digital divide in the United States. While the availability and affordability of connectivity is important, owning a device to access the internet is equally important. Broadband without a device is even less useful than a device without a network. A government program that tries to close to digital divide needs to pay attention to where a digital device gap does and does not exist.

Nielsen just published its Total Audience Report 2020 which also provides insights on device ownership by race. This allows us to glean important insights from the data and how it should inform policy makers, as there are similarities and significant differences when it comes to device ownership.

 TotalBlackHispanicAsianWhite
 Mar’19Mar’20Mar’19Mar’20Mar’19Mar’20Mar’19Mar’20Mar’19Mar’20
DVD/Blue-Ray Player62%57%54%47%52%45%47%44%65%60%
DVR55%52%52%49%49%45%44%42%56%53%
Smart TV45%52%42%51%54%61%57%65%45%51%
Internet Connected Device40%47%41%48%42%48%58%62%39%47%
Game Console43%40%43%42%54%52%50%46%41%39%
Computer79%78%68%68%72%72%89%89%82%80%
Smartphone92%93%93%95%97%97%97%97%91%93%
Tablet64%63%57%55%63%61%74%72%65%64%
Internet-enabled TV-Connected Devices71%76%69%75%78%82%86%90%70%75%
Subscription video on-demand69%74%63%70%73%77%81%84%70%74%

Source: Nielsen Total Audience Report 2020 – https://www.nielsen.com/us/en/insights/article/2020/marketers-its-time-to-engage-asian-american-consumers/

The most owned device in the United States is the smartphone. Ninety-three percent of all Americans own one. Contrary to common stereotypes, there is no significant difference when it comes to smartphone ownership – mobile is colorblind. White Americans are actually the laggards with 93% ownership when it comes to smartphone ownership as Blacks (95%), Hispanics (97%) and Asians (97%) are all reporting higher smartphone ownership. The high ownership is driven by the significant utility of smartphones – the Swiss Army Knives of the connected world. It fits in your pocket, allows people to talk, text and use the internet, and is readily financed through mobile operators or device manufacturers, bringing down the cost of the device to a manageable monthly installment.

Text Box: We need to make the ownership of computers and tablets as color blind as the ownership of smartphonesWhere we are seeing substantial differences is in computer and tablet ownership. As of March 2020, an average of 78% of Americans owned a computer. Eighty-nine percent of Asian Americans own a computer, followed by 80% of whites, but only 68% of Blacks. Similarly, 63% of Americans own a tablet. Again, Asian Americans have the highest device ownership with 72%, followed by white Americans with 64%, but only 55% of Black Americans own a tablet. Tablet and Computers are essential to closing the homework gap and, even more importantly, the testing gap. Unless every child and student has access and is able to participate in online learning and testing, the progress and grades for every child in the class cannot be counted in their official school record. This makes universal access critical for all, regardless of income and access. We need to make the ownership of computers and tablets as color blind as the ownership of smartphones.

While smartphone ownership has increased from March 2019 to March 2020, computer and tablet ownership has declined, together with ownership of other, increasingly obsolete technology hardware like Blue-Ray DVD Players, DVRs, and game consoles.

Blue-Ray DVD players and VCRs have been supplanted by video-on-demand services, which have seen a significant increase in adoption. Game consoles have also suffered from the shift to mobile gaming on smartphones and the lack of the introduction of new consoles. Both the Microsoft Xbox and the Sony Playstation 4 are seven years old and technologically obsolete, with both devices receiving a next-generation model at the end of 2020. Computers, including laptops, as well as tablets have also been struggling as they have been lacking the sorts of new features that have consumers chomping at their bits to buy a new one.

Text Box: If the government is serious in bringing the high-tech device supply chain back to the United States, it can require that the devices are being manufactured in the United States and have a proportion of the component come from the United States as well so that the stimulus money actually stimulates the US economy.Any stimulus plan that is genuinely interested in closing the digital divide and the resulting homework and testing gaps needs to address the device gap as well. Broadband networks without the right devices are like one-handed clapping. To improve learning and to raise and broaden the standard of digital economy skills, every student should have a device that can access broadband networks. If a student’s family cannot afford such a device, the government should provide aid to acquire one. If the government is serious in bringing the high-tech device supply chain back to the United States, it can require that the devices are being manufactured in the United States and have a proportion of the component come from the United States as well so that the stimulus money actually stimulates the US economy.

The proliferation of 5G launches offers a significant opportunity for the government to stimulate innovation akin to President Franklin D. Roosevelt’s Arsenal of Freedom initiative or the space program’s myriad of spin-off innovations that have made our lives better.

5G-capable devices should be at the core of such a program with both x86 and ARM processors. American companies like Intel, AMD, and Qualcomm would provide the technology that is at the heart of these devices – the processor – and sell them to any device manufacturer. Apple would build ARM processors for its own devices. Such a device stimulus plan could be the important accelerant for ARM processors in computers and laptops. ARM processors are at the heart of smartphone and tablets as ARM processors are very energy and heat efficient, but they only slowly make an entry into the computer world as their compute power is approaching and in some cases overtaking x86 processors. Qualcomm together with Microsoft has launched an ARM laptop and Apple is rumored to use its A-series processors in upcoming MacBooks. China’s Huawei has designed its entire AI, called Ascend, and a general computer program called Kunpeng on ARM technology and plans to build an entire ecosphere around it with a $1.5 billion investment over the next five years. The United States should at least be able to match a similar kind of investment to make sure it does not fall behind if there is a significant shift to ARM computing.

With the country on the brink of a slow and painful recovery from the pandemic, the time is now for Congress to direct money where it will have the biggest economic and societal impact.  Right now,  closing the digital divide and the homework gaps is precisely such an opportunity.  Enabling more Americans to afford an Internet-capable device is critical to the country’s recovery, and one of the fastest ways to give a voice to more black and brown Americans who are otherwise being left out of the country’s economic and other successes.

If you missed our analyst call on Wednesday with Roger Entner, Peter Rysavy and Avi Greengart you can listen in now! Topics discussed included 5G network deployment, the future of smartphones in a 5G world, cloud computing, use cases for artificial intelligence, and more!

What to Listen For:

“Even though the opportunity to connect to 5G today is limited – it’s amazing that we can connect to 5G at all. Because when we started working on the standards we weren’t expecting any deployment until 2020. So we’re actually a year ahead of schedule which is remarkable for the complexity.” – Peter Rysavy, Rysavy Research

On the benefit of advancements in AI and AR technology: “If you’re trying to wire up an airplane, having a heads up display where it can show you how to wire up the airplane in real time, with overlays of what you’re seeing and what you should be seeing…the return on investment is crazy high. It’s so high in fact, that in that particular use case, Boeing and Airbus are willing to develop these systems in-house, building their own custom software, in some cases building their own custom hardware.” – Avi Greengart, Techsponential

“Another topic that’s going to be really interesting is the whole convergence issue of telecommunications with content…70% of wireless usage is video, and so video becomes more and more important and some of the more obscure things that nobody paid attention to will become much more prevalent. For example, the STELAR re-authorization.” – Roger Entner, Recon Analytics

Have Questions? Head to Twitter and Chat With Us:

Host Roger Entner: @RogerEntner
Peter Rysavy: @peter_rysavy
Avi Greengart: @greengart

Working 5G
We are at the dawn of a new generation with 5th Generation networks launching. As with every new technology some launches are smoother and others are rougher. Since we are all doubting Thomas’s, we travel to the places where these networks are actually up to see with our own eyes if they work. During the first week of April, I was in Dallas to check on the status of AT&T’s 5G launch. Since smartphones with integrated 5G have not been launched yet, we tested AT&T’s network with their Netgear 5G hotspot. I done tests at approximately 50 meters, approximately 100 meters, approximately 200 meters, and tried to determine the cell edge to check the state of current technology.
For consistency purposes, I used Ookla’s Speedtest for all tests. To give you a benchmark, my Verizon FiOS fiber internet connection is 879 Mbit/sec at 1ms latency connecting to the Starry server in Boston. My AT&T Wireless LTE service on an iPhone X Model A1865 (Qualcomm chip version) in Boston was tested with 89 Mbit/sec and 58 ms latency connecting to the AT&T Wireless server in New York. Considering Boston is 215 miles from New York, we should deduct about 1 ms from the LTE connection speed time as light travels with 186 miles per millisecond to have a real apple to apples comparison. The 5G test in Dallas was to the server in Dallas.
I performed several tests at 50m, 100m, 200m and to determine the cell edge. The mmWave antenna is the little box to the upper right of the regular cellular antennas over the RREAF letters.

100m out from antenna

200m out from antenna

At 50 meters / 150 feet the speed was 1320 mbit/s at 24 ms latency, at 100 meters / 300 feet the speed was still at 1199 mbit/s and 23 ms latency. Going out to 200 meters / 600 feet, the speed dropped to 762 mbit/s but latency was at 18 ms.

At these speeds WiFi becomes the gating factor if you are using it as a hotspot. Even at 200 meters / 600 feet download speeds came close to my fiber connection at home and is at the level where the bottleneck is the connection to the website and not the connection to the consumer device. These are impressive speeds, especially this early in the 5G life cycle and deployment.
As I went further out to the cell edge, the signal finally gave out at approximately 250 meters. With the antenna being a small little block at the top right of the picture below, just above the hall, left from the trees.

Currently, the signal and thereby speeds drop off rather quickly beyond 200 meters / 600 feet, which shouldn’t be surprising considering AT&T uses 39 GHz for 5G. Operators that use lower frequencies should have large cells in the same conditions, simply due to the law of physics.
In a nutshell, 5G works and the speeds are actually better than what a lot of people expect. The good news is that performance will improve from the base line tested here as carriers and vendors learn more and improve software and deployment. Considering that in urban deployments, cell sites are usually spaced at 100 to 200 meter, 300 to 600 feet anyway, we can expect robust speeds from 5G without a dramatic increase in capex for a basic layer of 5G. This increases the time to deployment and reduces cost as existing infrastructure and backhaul is being used. When we get to a more robust deployment with limited line of sight and when the network gets more loaded, we will need to support it with more small cells. From a regulatory perspective, this gives us a little bit of time to stream line the US siting policies so that our 5G deployment does not fall behind that of China and other countries with fewer rules and regulations on where to deploy small sites.
Also, the limitations on the number and placement of 5G antennas on devices plays a significant role . Based on FCC filings the Motorola 5G addon has four antennas with a 7 centimeters (cm) or roughly 3 inches proximity sensor. When something comes within the 7 cm of an antenna the antenna shuts off. With 7 cm it is quite possible that somebody’s hand is within 7 cm of all four antennas and with it turns all four antennas off. Can’t wait for another press event about talking about holding the phone in the wrong way. Also it seems like Verizon or Motorola chose a technology indicator that only changes when in an active 5G session causing the indicator to change often which caused the confusion. These problems can be overcome with more antennas and proximity sensors that have a more precise proximity sensor.