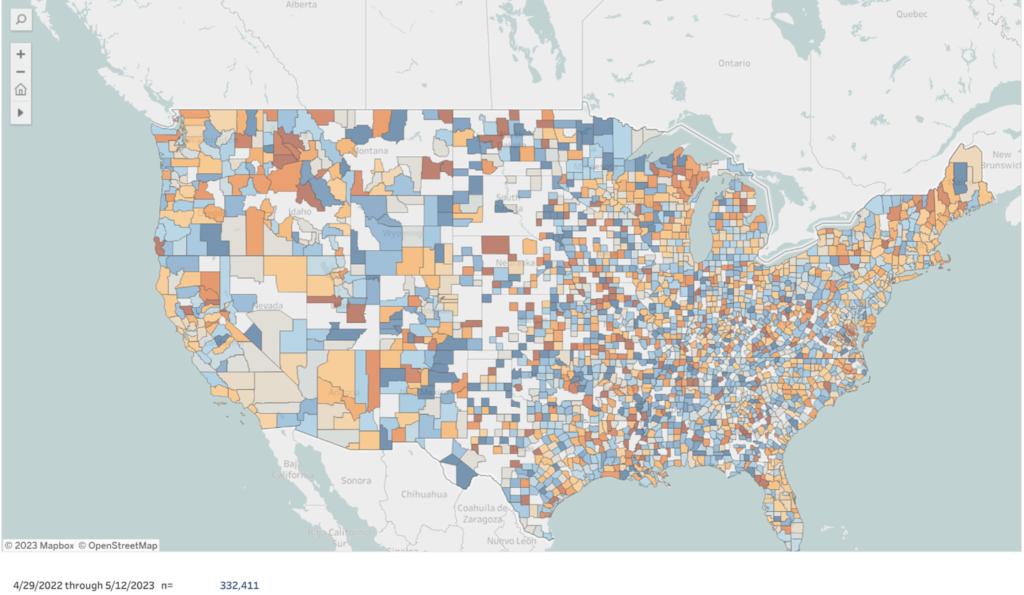
One of the key questions around the happiest and unhappiest home internet counties is where they are and what the driver is behind the happiness and unhappiness. Every week, we ask our respondents a battery of questions around how satisfied they are with the service they receive. After surveying more than three hundred and thirty thousand respondents later, we have respondents from 2,368 counties out of 3,142 in the United States telling us are telling us where the happiest and unhappiest broadband customers in the United States and allows us to determine the root cause behind their experience.

Questions that we aim to answer include: Why is home internet service in some places better than in others? Will the famous opening lines of Leo Tolstoy’s book Anna Karenina – “All happy families are alike; each unhappy family is unhappy in its own way” – be applicable here? Are the larger observable trends, where fixed wireless NPS outperforms Fiber – which outperforms cable, which beats DSL and WISPs – be consistent in a granular county-by-county perspective? Does it matter if a county is in a blue state or a red state? Is the size of a provider any indication that the home internet customers in a county are happier or unhappier? Let’s just say that counties do not show the same behavior as Tolstoy’s families: it all comes down to local execution.
Let’s get politics out of the way first: Five of the ten unhappiest and five of the ten happiest counties are in states that are considered “Republican” and “Democratic”, respectively. Neither party’s approach to how they interact with home internet providers has had an impact on the distribution of the ten happiest and unhappiest counties.
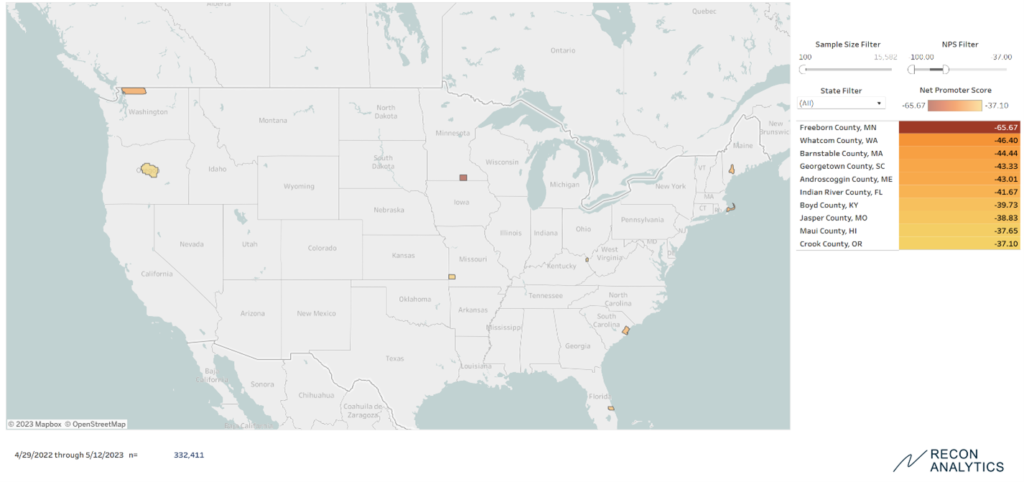
Below is a map of the ten unhappiest home broadband counties in the United States with at least 100 respondents to ensure statistical veracity.

Interestingly, all the counties where the unhappiest home broadband customers are residing are rural counties with one exception: Indian River County, FL, the home of Vero Beach. This county, which is largely suburban, has the fourth highest concentration of millionaires on the United States. The population range per county is between 25,000 and 180,000 people. They are being served by between two providers in Barnstable County, MA and 14 providers in Jasper County, MO, which tells us that limited or significant choice is not a driver of unhappiness, especially when all of the counties are served by all technologies from fiber to DSL. Even if we controlled for coverage, we had some counties where there was fiber coverage in every ZIP-code (we did not check if every physical address was covered) like Georgetown County, South Carolina, Indian River County, FL, or Crook County, OR to where almost none of the ZIP-codes in a county, like Barnstable County, MA, were covered by fiber. These type of systemic, technology-driven or industry structural reasons are not providing the answer, despite being commonly accepted truths. In four of the ten unhappiest counties, membered own co-operatives which are typically non-profits were active.
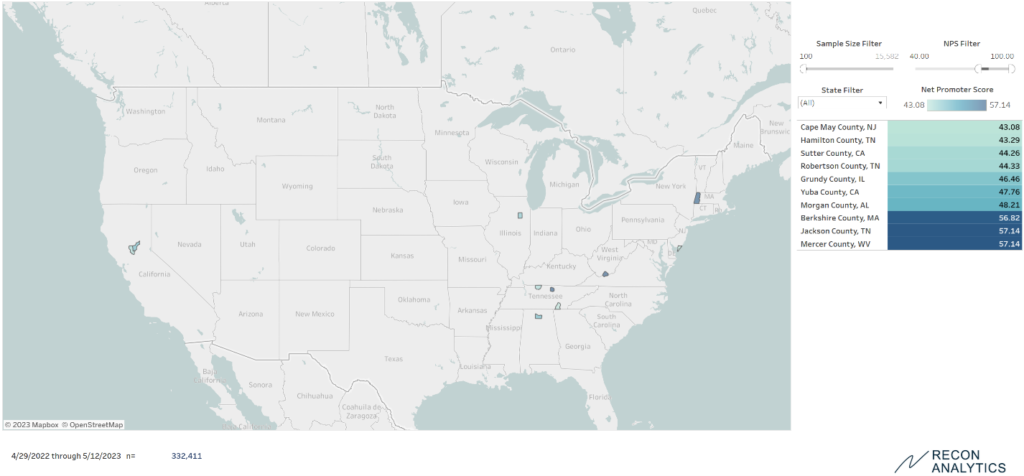
We then looked at the happiest home broadband counties in the United States. The map confounds the expectations of many.

Who would have thought that four of the happiest broadband counties are in the rural South of Tennessee, Alabama and West Virginia? Nine of the ten happiest counties are rural. In six of the ten happiest counties, coops are active, but not in the happiest broadband county, Mercer County, WV. The poster child for municipal broadband, Chattanooga, TN, comes in as the 9th happiest home internet place in the country. The happiest county, Mercer County, WV does not have any coops providing telecom services there. In six of the happiest and four of the unhappiest broadband counties, coops are providing service. The mere presence of coops is providing better services, as the feedback we receive from customers ranges from terrific to terrible. Fiber or Cable coverage is also not playing a determining role.
The other fascinating insight is what is missing from the list: major urban markets. The idea that urban markets get all the investment because they are densely populated and cheaper to service, and therefore have the happiest broadband customers, is just not reflected in the data. At the same time, the rival argument that urban areas are dystopic wastelands with horrible broadband service is equally not supported by the data.
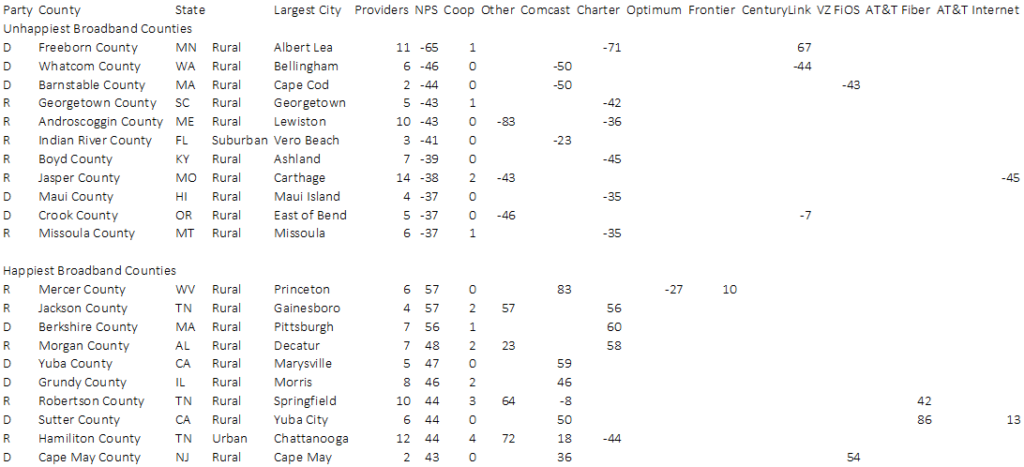
In the end, we found that what really matters is the individual performance of a provider in a given county. Below are the NPS scores for the providers with at least 20 respondents in each county where we had at least 100 respondents overall.

Almost all the providers displayed uneven performance. The same provider that performed very well in some counties performed poorly in others. Cable providers like Comcast and Charter performed very well in some counties. Comcast’s exceptionally good performance made Mercer County, WV the happiest broadband county. Equally, its poor performance in Barnstable County, MA and Whatcom County, WA made them the second and third unhappiest broadband counties. Only AT&T Fiber performed consistently well in the ten happiest counties and was not present in the unhappiest.
Additionally, 5G fixed wireless service did not make an impact on the happiest and unhappiest broadband counties. While in some of the counties there is 5G fixed wireless service, the adoption numbers were so low that they didn’t make an impact on the overall happiness of broadband customers.
Our research shows that every provider is able to do excellent work and make their customers happy. Considering that the nationwide providers engage in nationwide standard pricing, the satisfaction score differences are not driven by low price, but by actual performance. Technology helps, but the key is local execution. Providers could improve their performance in markets by internally benchmarking their performance and extending best practices throughout the entire organization. Regulators should look at how satisfied the customers of applicants are before the allocate their broadband subsidies to expand services. If they have multiple applicants for subsidies, they should be given to the providers who deliver for the taxpayers, who provided the funds through taxes in the first place.


