5G fixed wireless access (FWA) is transforming how Americans are accessing the internet. In less than three years, 7.9 million customers signed up with FWA as their preferred internet solution. Recon Analytics interviewed more than 40,000 home internet customers in the first 12 weeks of the year and the results are clear: FWA customers are happier with their service than with service through any other technology. The only thing standing in the way of greater success is more capacity, which is why mobile operators are clamoring for more licensed full-power spectrum.
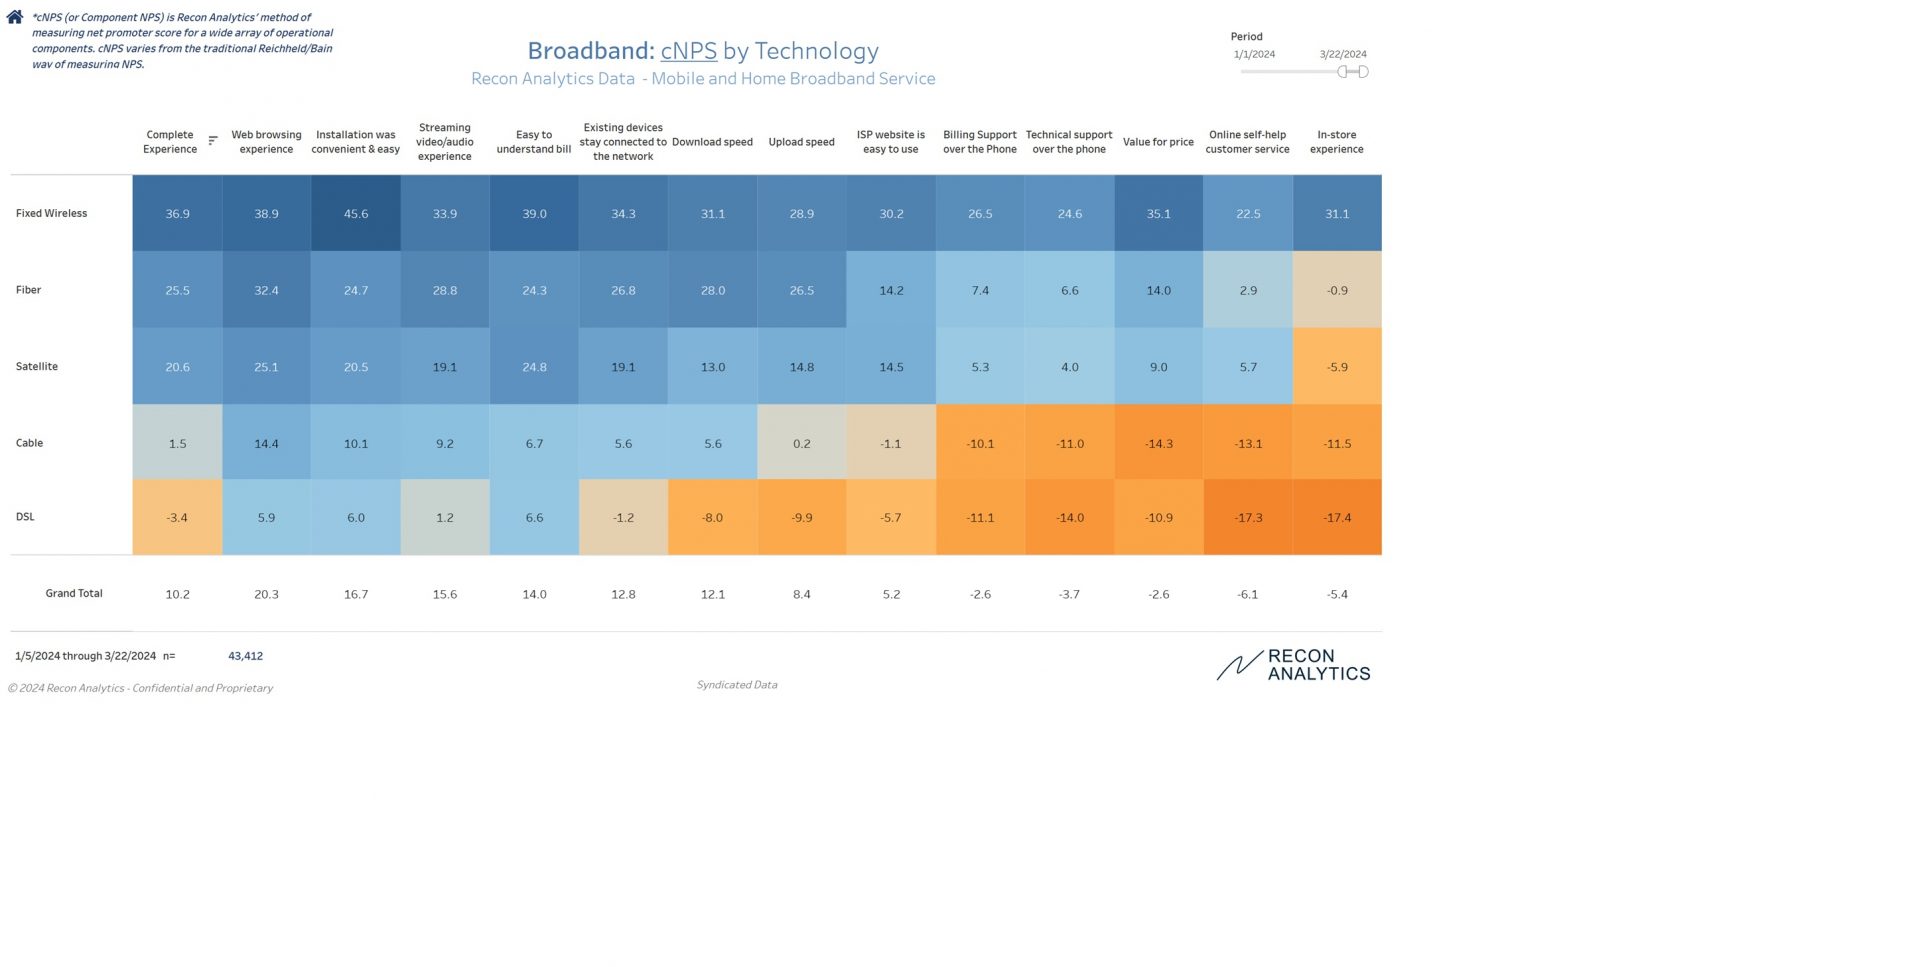
Chart 1:
FWA is the clear winner across the board
The ranking in Chart 1 makes sense, but is surprising at the same time. The mobile network operators built a very robust offering. FWA is not the fastest service, but under the current usage parameters it satisfies its customers not only on the traditional product side such as easy and convenient installation, a superior router experience, delivering an easy-to-understand bill, and online self-help customer service that people actually like, but also on the service side, ranging from the internet usage categories, to support over the phone and, most importantly, value for money.
It is important to keep in mind that there is a double bias going on with FWA customers. First, the vast majority of FWA customers have the same provider for their mobile service. Customers who are unhappy with their mobile service do not select the same provider and network for their home internet service. Second, there is a survivorship bias. Customers who sign up with FWA typically do this while they are still using a previous service with which they are unhappy. It is very easy and convenient to install and, if necessary, to return the FWA router and cancel the service, so prospective customers give it a try and take advantage of the cancellation poicy if it doesn’t work. We have a hard time finding customers who try the service and are unhappy with it, but have not returned it yet.
Customer service and connectivity
Chart 1 also reiterates what we have known for a long time: cable companies have poor customer service and need to improve. Telecom providers who are phasing out DSL networks and focusing on fiber provide substantially better customer service. What might surprise people is the strong performance of satellite service. This is mostly driven by Starlink, which is getting successively better over time, as a provider of last resort for many of its customers.
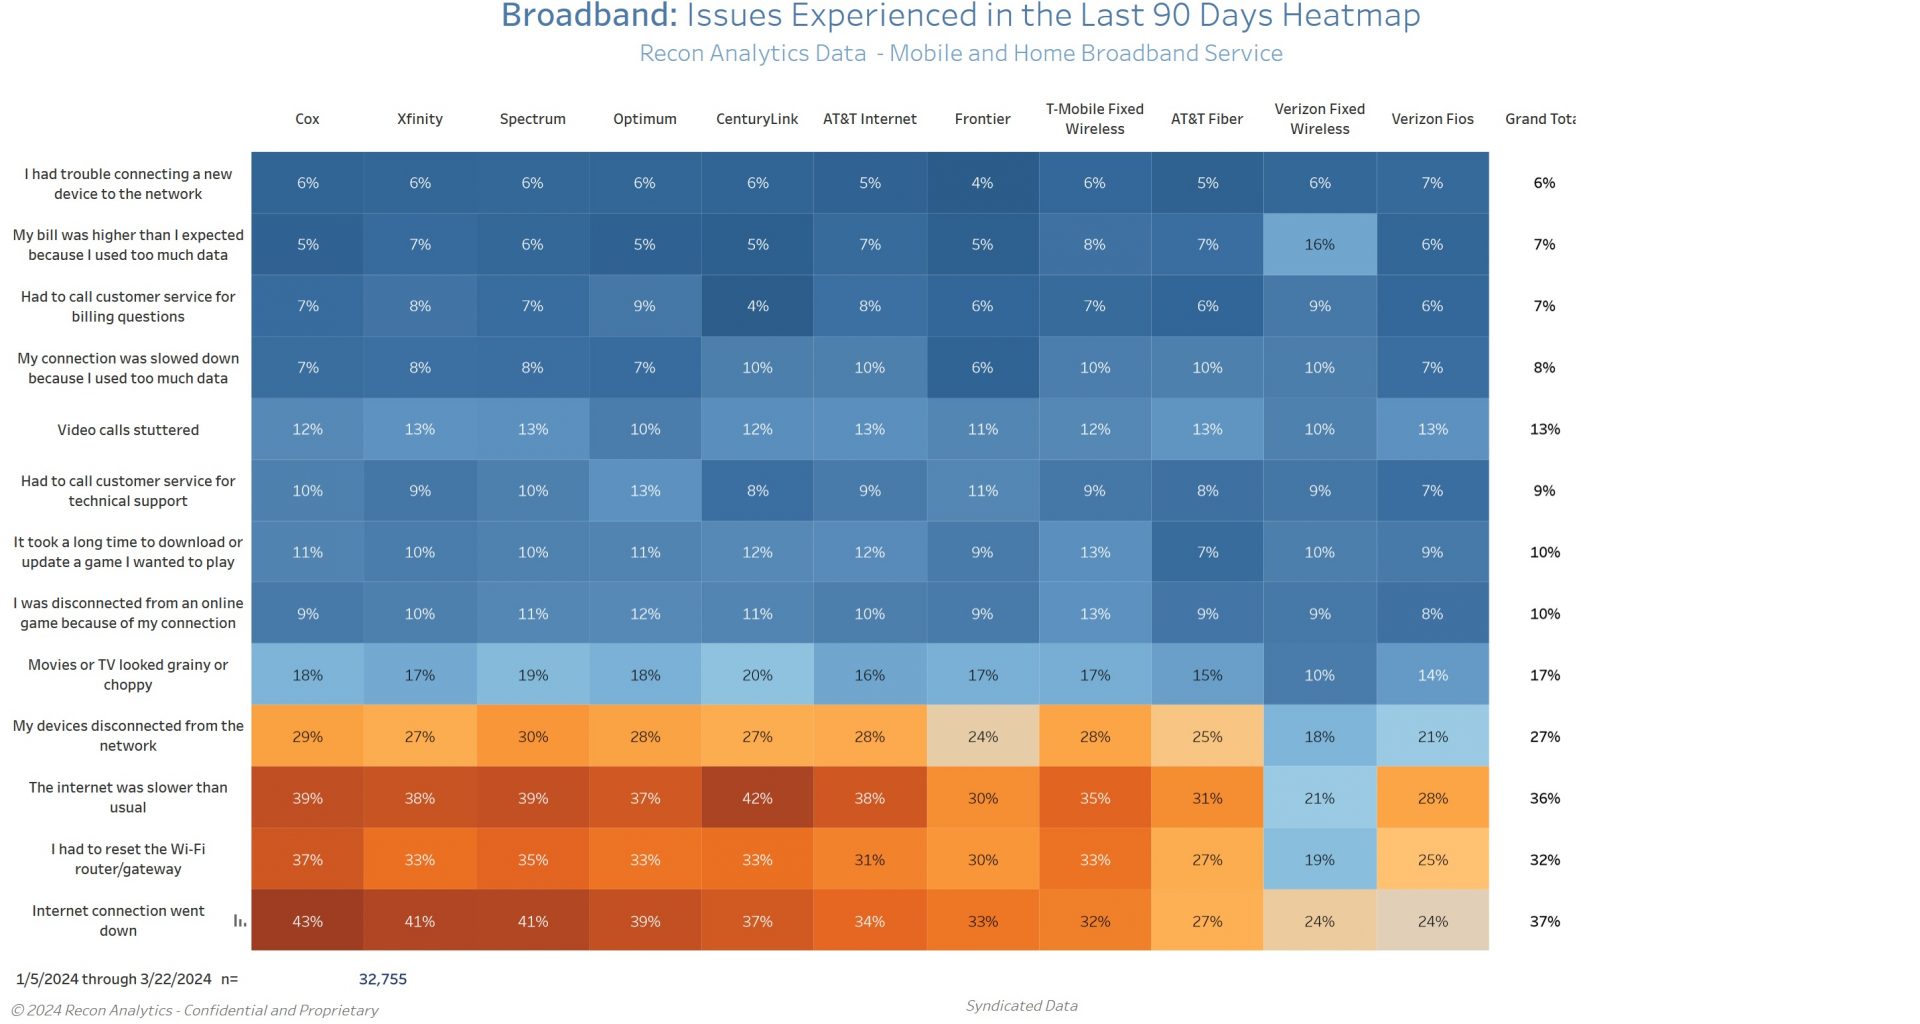
Recon Analytics also asks its home internet respondents every week what kind of issues they experienced with their internet connection. Chart 2 is ordered top to bottom with how often respondents experienced an outage. The most common issue, which was internet connection going down, is at the bottom. Furthermore, it is also ordered from left to right by how often they experienced their internet connection going down.
Chart 2:
As we can see in Chart 2, most of the issues are in one of two groups: internet connection going down or slowing down, and router issues forcing people to reset their router or having devices disconnect from the network.
Cable providers had the most issues in all four categories. Up to 43% of respondents reported that their internet connection has been interrupted, while fiber and FWA customers reported the least problems in this category. The newer, better routers provided by fiber and FWA providers also caused fewer problems compared to the routers from cable companies and DSL providers. One fiber and DSL provider told me that once they went away from sourcing the cheapest router to providing an excellent router, it was a game changer for them. The change reduced customer service calls and churn and improved customer satisfaction, more than offsetting the cost of the better router.
How to create more and better home internet choices
As of right now, the Congress and the FCC have created meaningful competition through up to three new providers with up to four brands in the markets where mobile network operators have been able to launch their service. It is incredible that even though we have seen network speeds for some providers decrease from 200 and more Mbps to low 100s Mbps, cNPS scores have not declined. MNOs still have enough capacity to provide their customers with sufficient bandwidth for what customers describe as a superior experience. Verizon and T-Mobile said that they have enough capacity for 5 and 7 million customers respectively with their initial FWA build. They are two thirds to that goal and will probably reach it by the end of 2024. After that, it will become more difficult and expensive to find the necessary capacity to compete with cable and DSL providers as vigorously as they do today. FWA is the fastest growing segment of the home internet market, while cable subscriptions are decreasing.
The government has three options, but the choice is pretty clear: It can spend $80 billion on various fiber incentive programs (BEAD, RDOF, etc) to bring another provider to markets where there is no provider offering more than 100 Mbps speed. It can take $80 billion from the wireless carriers for more spectrum (C-Band Auction for 240 MHz yielded $81 billion) and get three new broadband competitors in the form of FWA providers. Or, it can do both and create more and better home internet choices for Americans with a net zero cost.
Recon Analytics recently conducted the largest survey run to date to assess whether consumers eligible for the Affordable Connectivity Program (ACP) are actually enrolling and if so, what they are using their ACP funds for.
We conducted nationwide consumer surveys among ACP-eligible Americans from April 28 – May 5, and August 18 – 27, 2023. We asked 29,141 ACP eligible Americans if they use ACP, and if so for what.
We were not at all surprised with our survey findings, but some policymakers might be.
Recall that ACP is a program that provides “eligible” Americans $30 per household for internet connectivity. Who is eligible? Figure 1 sets forth the categories of citizens eligible for ACP. These “categories” of low income individuals are from existing federal government subsidy programs.
Figure 1
Of the almost 53 million ACP-eligible households, more than 20 million have signed up. The states with the highest number of consumers receiving ACP subsidies are “red” states Louisiana, Ohio, Kentucky, and North Carolina.
The program is currently set to expire in early 2024 absent additional funding by Congress.The big question inside the Beltway is whether funding the ACP is a good use of taxpayer dollars. The ReconAnalytics survey indicates that if Congress is interested in seeing itself reelected, extending the ACP funding might be a good idea.
The Data Says ACP is Working to Close the Digital Divide … Among Republican Voters
When we compare ACP enrollment across red states and blue states (defined by the party who won the last senatorial election in the state) , we observe that the percentage of households which would lose access to the internet is higher in red states than in blue. 39% of ACP enrollees live in Red States and 34% live in blue states. Members of Congress ignore this reality at their peril.
But what about the enrollees, what are they using their ACP subsidy for? Consider that the largest proportion of households at risk of losing ACP are ones with school-age children. No surprise then that our survey reveals that these same households use their ACP subsidy for school work online.
In aggregate, about 55% of respondents who told us they would be unable to access the internet without ACP were white, 16% Hispanic, 12% black, 9% Asian, 6% Native American or Pacific Islanders and 2% were of another race.
Figure 2 – ACP Enrollees by Race, Ethnicity, Age and Income Distribution
Full Time Period
Income
$0-10k
$10-25k
$25-50k
$50-75k
Total
Not able to access the internet w/o ACP
36.2%
39.2%
34.8%
28.4%
36.2%
Race & Ethnicity Distribution
White
47.9%
59.2%
57.5%
48.9%
54.5%
Hispanic
18.8%
14.1%
17.5%
15.3%
16.3%
Black
15.8%
10.6%
11.0%
13.4%
12.3%
Asian
9.2%
7.4%
6.7%
15.3%
9.1%
Native American & Pacific Islander
5.4%
6.9%
4.4%
5.3%
5.5%
Other
2.9%
1.9%
3.0%
1.9%
2.4%
Age Distribution
18-29
31.0%
15.9%
20.5%
22.5%
21.5%
30-44
26.4%
21.2%
33.6%
45.0%
31.0%
45-60
34.3%
40.5%
32.9%
25.6%
33.9%
>60
8.3%
22.5%
13.0%
6.9%
13.6%
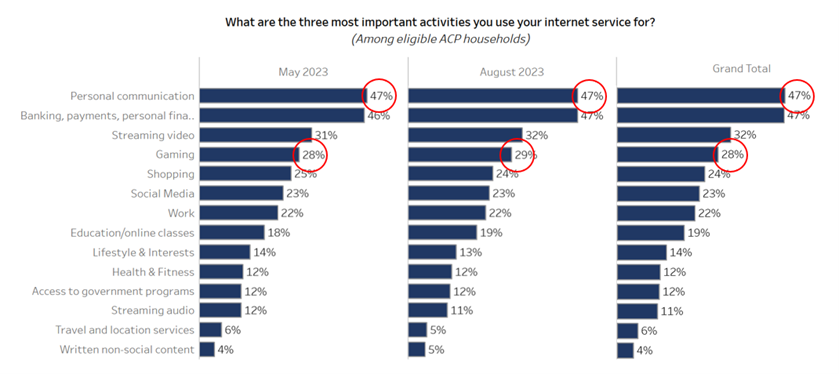
In Figure 3, we are looking at the activities that ACP households in general and in Figure 5, ACP households that would lose internet access but for ACP, are engaged in.
We show the data for both survey waves to highlight the consistency of the results over time. The two most used applications for their ACP connections are personal communications and banking, payments, investments and personal finance. In other words, ACP subscribers are using their subsidy to allow them to connect to the Internet and engage in the digital economy, whether it’s paying their bills or buying school supplies for their children. Almost a quarter of ACP recipients use their internet connection for purchases, more than one in five (22%) need their internet connection for work, one in five (19%) for online education, and one in 8 (12%) to access government programs.
Figure 3: Behavior pattern of ACP-eligible Americans regardless of ACP participation
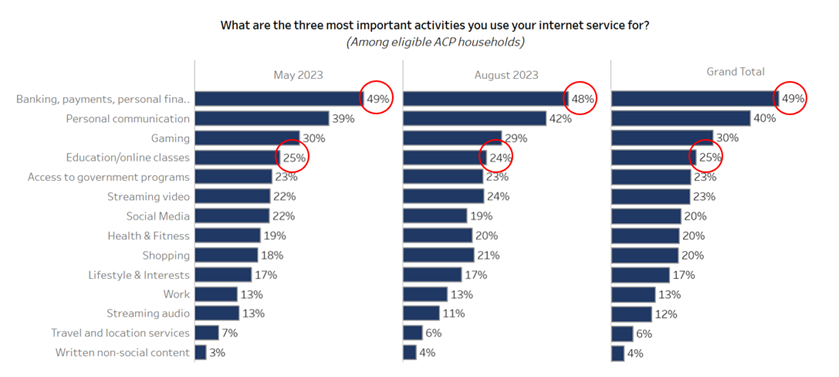
Figure 5 shows the impact of losing ACP. It also shows what applications really matter to people who critically depend on ACP for their broadband connection. Banking and financial transactions, education and access to government programs are priorities for these citizens.
Almost half of ACP recipients would lose internet access altogether if ACP were to go away.
This potential outcome presents a Catch-22: the government has pushed many programs online as a cheaper way to deliver services to low-income Americans. Due to ACP, 22% of the targeted beneficiaries of this policy are receiving those services. If ACP goes unfunded, 22% of the the very Americans Congress says it wants to help out of poverty will be stranded.
Seems like ACP is working but perhaps will be so effective, Congress will kill it, but at their peril.
Americans overwhelmingly support that broadband should be available to every American and that the funding base to achieve that should be broadened to every company that makes money through the internet.
More than 78% of respondents agreed that broadband internet should be available to every American showing broad support from large parts of the population. When looking a bit closer at the answers given by respondents who say they have broadband versus the people who said they didn’t have broadband, the support of those respondents who do not have what they consider broadband (26%) for everyone having access to broadband drops to 64%. This indicates that there is not only an availability and affordability gap but also an educational gap. Many people who don’t have broadband internet access either do not want it or do not understand why they should have it. These findings, which are mirrored in other studies, indicate that any broadband infrastructure program should include an educational component to increase the number of broadband subscribers. Otherwise, broadband penetration will never reach its full potential.
As we found in previous surveys on the topic, around 54% of respondents use the internet for work purposes from home. This is equal to the number of employees that are classified as white-collar employees by the U.S. Department of Labor. This number highlights the importance of broadband for the functioning of American businesses and enterprises during the continuing pandemic. It is likely that the added agility and flexibility to work from home will continue to be utilized after the country has emerged from the pandemic restrictions. We also found similar opinions around what Americans consider broadband. The median American considers 50/5 MBits as broadband whereas the most answered response was Gigabit speed with 29% of respondents.
The high percentage of Americans who think broadband should be available to everyone is probably based on the intensive usage and the need of many Americans to use it from home to work. Using the weighted average of the responses, Americans spend around six hours every day on the internet.
How many hours do you spend on the internet with a mobile device or computer?
Use the internet from home for work
Does not use the internet from home for work
Combined Response
Less than an hour
4.8%
18.0%
10.9%
Two to four hours
18.1%
36.0%
26.4%
Four to six hours
15.2%
26.3%
20.4%
Six to eight hours
25.2%
8.8%
17.6%
Eight to twelve hours
25.7%
4.8%
16.0%
More than twelve hours
11.0%
6.0%
8.7%
When looking at those who also use the internet from to work from home, unsurprisingly the usage pattern is significantly heavier as their usage pattern includes both business and leisure activities.
While only 37% of respondents knew that the Lifeline Program provides low-income Americans with basic phone and internet service, they were open to new funding sources to close the digital divide. More than 71% of Americans are in favor that companies with business models that rely solely on the internet to exist and who also generate revenue from those businesses, like Google and Facebook, also contributing to provide access to Americans who currently do not have access to the internet. Such a move would dramatically expand the funding sources for a broadband access plan and include companies that have exerted the most valuable and profits from the internet.
What is really interesting, the survey also found support to extend net neutrality rules to websites and ecommerce companies. We framed questions around the net neutrality principles of no blocking, no throttling speeds, and no paid prioritization by asking Americans if websites like Google, Facebook or Amazon should be allowed to restrict access to legal sites, give preference to their own products and services over others and change the search results based on how much money they receive from others.
More than 72% of Americans are against companies like Facebook or Google restricting access to legal sites for any reason. This is exactly the behavior that Facebook showed when it made it impossible to link from Facebook to news sites in Australia (and for a short time to itself) to avoid having to compensate news sites linked to. In essence, it was a commercial and legislative conflict where Facebook wanted to use its customer base as a bargaining chip in its negotiations. This is the essence of the “No Blocking” rule in net neutrality.
More than 55% of Americans believe companies like Amazon, Google, or Facebook should not be allowed to give preference to their own products and services over that of others, a self-dealing practice that has cost Google more than $10 billion in fines by the European Union. Search engines like Amazon, Google, and Facebook, all of which provide you with what you are looking for, are increasingly the prism through which we see the world. They have incredible power over our perception of what it is we are actually looking for. By pushing competing products into the obscurity of lower-ranked results, they, in essence, throttle the success of other products that are better but do not fit the commercial objective of the search engine provider.
In terms of pay-to-play result manipulation, more than 80% of Americans say they are against search engines altering results based on how much websites and advertisers pay for preferential positioning. It is common that the first view search results for a given term are occupied by responses that are marked by the easily missed word “Ad” in front of the link. This effectively operates as paid prioritization, something the ISPs are not allowed to do under California’s net neutrality law, nor under earlier versions of net neutrality that the Democrats might be considering reinstating.
The results of our survey showcase two key points: Americans are open to reigning in tech giants, who solely rely on the internet to generate revenue, and curbing their ongoing uncompetitive behavior, and having these companies contribute part of said revenues to subsidize access to broadband for low-income Americans. While the Biden Administration focuses on proposing ideas that have been tried and tested, perhaps it should take a step back and listen to consumers, who are those who the administration ought to serve and prioritize.
While we all agree that the United States needs more broadband and net neutrality, most Americans do not support the Biden administration’s plan. The majority of Americans want internet companies to pay their share to build the broadband network that these companies are profiting from. They also want to be protected from the demonstrated behavior of internet-based companies that violate the net neutrality rules that these companies want to impose on other companies but not themselves. Net neutrality rules need to protect consumers and not one set of companies that want to prevent other companies to effectively compete with them. Any net neutrality rules that do not apply to internet service providers and internet companies like search engines, social media companies, and e-commerce providers is just cleverly disguised corporate welfare with the government picking winners and losers.
Between March 16 and March 26, 2021, Recon Analytics conducted a demographically representative survey of 1,000 Americans using the internet and cell phones, asking them about their opinions and attitudes around universal access, funding mechanisms, conduct, and usage.
Do you believe that access to broadband internet should be available to every American?
Yes 78.2% No 21.8%
Did you know that the government requires a small portion of your phone bill to be used to fund phone service for low-income Americans aka lifeline service?
No 62.9% Yes 37.1%
Do you think companies like Google and Facebook that make money through the internet should contribute to the provide access for Americans who do not have the internet?
Yes 71.4% No 28.6%
Should companies like Google or Facebook be allowed to restrict access to legal sites for any reason?
No 72.7% Yes 27.3%
Should companies like Amazon, Google, or Facebook be allowed to give preference to their own products and services?
No 55.8% Yes 44.2%
Should search engines be allowed to alter search results based on how much money they receive from websites or advertisers?
No 80.6% Yes 19.4%
How would you define broadband internet access?
3/1 9.3% 10/1 9%
25/3 14.8% 50/5 17.3%
100/10 20.9% Gigabit 28.8%
Do you currently have broadband internet access?
Yes 74.2% No 25.8%
Does your job require internet access at home?
Yes 53.4% No 46.6%
How much time per day do you spend on the internet (via your mobile device or on your computer?)
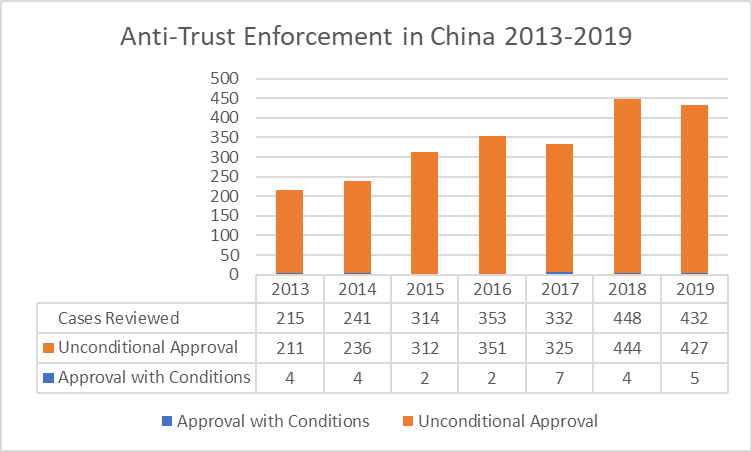
As China has become a major global economy and grows more assertive on the global stage, the country has discovered the power of anti-trust legislation. While created on three common pillars of fighting anti-competitive agreements between companies, the abuse of a dominant position, and mergers that may eliminate or restrict competition, the implementation is increasingly different. There have been hundreds of cases where Chinese authorities have looked at mergers between Chinese companies, and not one has been objectionable to the authorities. But if it doesn’t matter that two separate companies are owned by the state or merged, how can a merger between state-owned businesses be anti-competitive?
In a state capitalist system, as we have now, Communist Party groups are part of every company, including private domestic or international joint-ventures and all foreign investment is in the shape of a joint-venture with a Chinese partner with three or more employees. While they have long-established formal power in state owned enterprises (SOE), for joint ventures there is increasing pressure to allow party groups to approve all critical matters before they are presented to the board based on the 2017 Communist Party Directive entitled “Notice about firmly promoting writing SOE party building work into company articles of association.” Following this logic, reviews of intra-Chinese mergers have always been approved.
Mergers in the last decade
As you can see from the chart above, there are no outright merger rejections and only a small number of approvals with conditions. Interestingly, the only mergers that have come under scrutiny are mergers without Chinese involvement. Due to the extraterritorial nature of Chinese anti-trust law, even mergers of companies outside China fall under its purview when it involves companies with a substantial amount of business in China. For example, in 2019, the five cases that were approved with conditions were KLA Tencor (US)/ Orbotech (Israel), Cargotec (Finland)/ TTS (Norway), II-VI incorporated (US)/Finisar (US), Zhejiang Huayuan Biotechnology (PR China)/Royal DSM (Dutch), and Nevelis (US)/Aleris (US). In addition, there are cases like Qualcomm (US) / NXP (Dutch), where instead of denying the application, Chinese anti-trust authorities just ran out the time. After two years of waiting for the acquisition of NXP by Qualcomm to be permitted, the companies reached the end of the contractual merger period and were forced to give up. This de facto denial was never recorded as a denial, as the Chinese anti-trust authorities simply did not rule. Due to the small size of China’s anti-trust authority, the country has plausible deniability when it delays ruling on a merger. At face value, China’s perfect record of only approving mergers remains intact, when in reality the merger was forcibly abandoned.
What’s really at stake
Cases such as those mentioned above create the appearance that Chinese anti-trust concerns are not directed at protecting Chinese consumers but protecting Chinese industrial policy. The approval with conditions of the Marubeni (Japan) acquisition of Gavilon (US) and Glencore (Swiss) of Xstrata (Swiss/UK) demonstrates that China’s industrial policy leads anti-trust merger enforcement. In both cases, China was concerned about the supply of vital commodities, copper and grain respectively, and the merger was approved only after significant divestitures that alleviated these concerns.
With this in mind, the acquisition of ARM Technologies (UK) from Softbank (Japan) by Nvidia from the US will be another interesting case. Most casual observers would conclude that Chinese anti-trust authorities would not be involved. Au contraire, mon ami! Almost all smartphone central processors are using ARM instruction sets, and Chinese companies have built their AI and neural processing technology on them. Huawei even went a step further and built its Ascend AI and Kunpeng general purpose processor programs entirely on ARM. The increasing reliance is due both to technical and to political reasons.
President Trump’s moves to use American intellectual property in trade battles with China, as well as restricting their use in military and dual-use applications, has complicated the lives of Chinese high-tech companies and it is likely to continue during President Biden’s administration. As a reaction, China has accelerated its Made in China 2025 project focused on reducing its dependency on foreign technology and products and shifting to non-American suppliers. If the Nvidia acquisition of ARM goes through, another key technology will be more closely under the control of US authorities, giving them another potential tool to assert pressure on China. It would also give Nvidia a significant boost in the AI competitive race that China considers one of its highest priorities. Nividia is a leader in network-based AI and ARM a leader in device-based, also known as edge AI. Combining the two companies makes them a much more formidable competitor, allowing to cross pollinate network AI with edge AI technology and vice-versa. Both companies have substantial business in China and hence fall under Chinese anti-trust laws and are subject to review.
Considering China’s track record, it is almost inevitably going to either block or just refuse to approve the Nvidia/ARM transaction to protect its domestic industry from further US sanctions and restrictions and to prevent a stronger competitor in the AI marketplace. It is more likely that China will simply run out the clock on the merger, while a more aggressive and higher profile move would be an outright denial of the merger. This would send a much stronger signal to the United States than passive aggressive non-approval and would be a harbinger of a more adversarial phase in the relationship between the two countries.
Over the past 15 years, there have been several government initiatives to expand the adoption of broadband in the United States. At the same time, industry has been busily focused on extending the reach and capacity of both fixed and mobile broadband networks. Yet, a digital divide still exists. Why? Let’s review the history here.
Since xxx, the cable and telecom industry have successfully provided broadband connectivity to more than 110.8 million households, adding about 2.4 million households per year. Gigabit speeds are now available to 85% of households. The broadband companies expand their footprint in an economically responsible way as they are accountable to their shareholders. Regardless, this leaves us with 17.7 million households left to cover. With the number of households increasing by roughly one million per year, at the current pace this would take us around 13 years. The current pandemic, with its work and study from home demands, shows us that we do not have 13 years to close this digital divide. In order to make the best possible decision on how to solve the problem, we should look at what has and has not worked in the past.
One of the most hotly debated solutions being proposed to close the digital divide is to have the government support municipal broadband, a catch-all term for providers of broadband that includes telephone and electric cooperatives. The general caveat of government entering what is a private business market is what economists call crowding out. A for-profit company typically has no chance of competing against a government entity. The latter does not have a profit goal and can provide service at a loss for an infinite period of time, as it has access to government revenue in the form of taxes or bonds to cover the losses. At the same time, the government has a poor record of innovating adjustments to a rapidly changing technological environment. The pro-municipal broadband argument holds that if for-profit companies are not offering services in a particular geographic location, they cannot be crowded out.
Electric cooperatives were founded in the 1930s to solve the 20th century equivalent of the broadband problem, and the solution is instructive for our current situation. The Institute of Local Self-Reliance, an organization in favor dispersing economic power and ownership, identified eight municipal networks that failed in the United States. The common thread of failure was inexperience in running customer-facing organizations as a neophytes struggled to learn a new skill set. This highlights the gap between running a relatively small number of government services and running much larger and more technically complicated broadband network and the problems recruiting the people with the right existing skill sets.
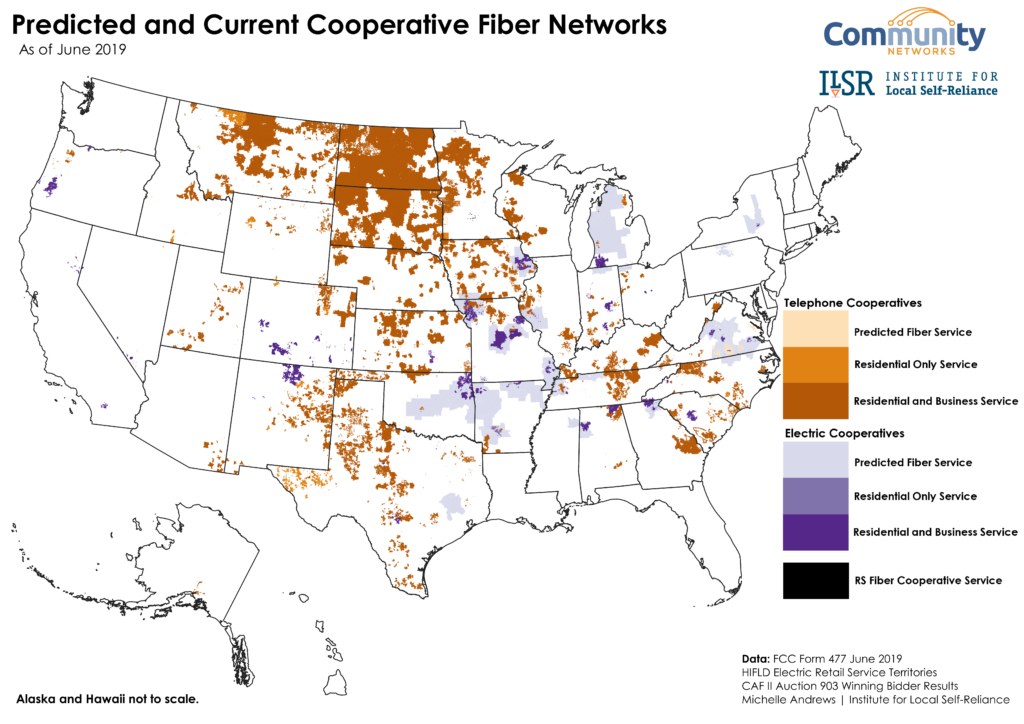
The most likely scenario for success is the addition of broadband service to an existing electric or telephone cooperative’s portfolio. In this case, an entity with experience in running a customer-facing operation and network for decades simply expands its service. The cooperatives are already serving mostly rural customers and do not crowd out for-profit cable and telecom providers. The FCC has recognized this and has explicitly included electric cooperatives in the Connect America Fund II initiative (which we will discuss later)
As we can see from the map above, the opportunity for rural broadband coverage from cooperatives is significant as rural areas often in the South and the Great Plains have low population density. Perhaps engaging both electric and telephone cooperatives in rural areas is an effective way to close the digital divide in some areas. These could take the form of public private partnerships and potentially avoid the pitfalls of muni-broadband.
Muni-Broadband has failed for different reasons. Research shows that most of the failed entities are urban, often engaging in direct competition with incumbent providers. Examples such as Monticello, MN, Salisbury NC, and Tacoma, WA come to mind. In other cases, the municipal broadband networks such as in Muscatine, IA, Utopia, UT had to be bailed out by taxpayers or the electric cooperative because it could not stay afloat. We also have Provo, UT and Groton, CT, which ended up selling to private companies at a great loss to tax payers, and Burlington, VT where the lack of oversight and cover-up of incompetence lead to failure to Bristol, VA where corruption meant the end of the network.
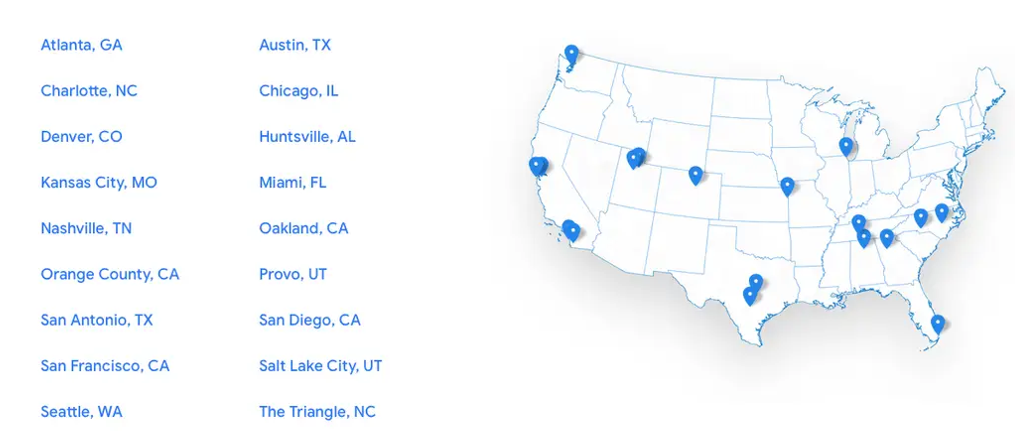
In 2010, Google announced that it would start providing broadband fiber connectivity in a number of cities to between 50,000 and 500,000 households. Cleverly, Google put out a request for information asking municipalities to apply to have Google offer fiber in their city or town. This reversed the traditional relationship between provider and municipality. Traditionally, the provider asks the municipality if it can provide service in the area. The municipality responds with what they ask for in terms of fees and extra services. Ever wondered why so many pools, parks, and sports areas are sponsored by telecom and cable companies? It was one of the demands of the city in order to allow the service provider to offer service in the town. By inverting the relationship and asking towns to apply to Google for consideration, Google shifted the power relationship, and was able to receive such favorable terms that telecom and cable providers went to cities and demanded the same terms and conditions that Google got, but they were never able to get by themselves. Under equal treatment rules, these cities had to extend the favorable Google terms and conditions to every other provider. Kansas City was the first city Google Fiber launched followed by Austin, Provo, and fifteen more cities. The Provo network was a defunct municipal network that was built for $39 million and then sold to Google for one dollar. After realizing the high cost to build a fiber network and the long delay of a payback to themselves, Google first halted further network expansions after it had deployed in five cities, and then switched to a private public partnership (PPP) model where the municipality builds the network and incurs the cost and Google sells the service. In addition, Google made an acquisition in the fixed wireless broadband space to also provide broadband wirelessly. This has slowed down the expansion significantly, but the scope has increased beyond what can be called a trial – as Google likes to call every endeavor they get into – as Google now covers 18 cities.
The 19th market for Google Fiber will be West Des Moines, Iowa. Similarly to Huntsville, Alabama, the city will build a fiber network for $39 million, in exchange Google will pay the city $2.25 for each household that connects to the network. Over the 20-year agreement, Google will pay at least $4.5 million to the city. The project will be completed by the end of 2023. By entering PPPs, Google gets the various cities to pay for the expensive built out and make money by providing the service. Google’s experience highlights that even one of the largest companies in the world does not have the focus, wherewithal and patience to actually build out a nationwide system, but relies on the government to pay for the physical buildout.
When the government helps in areas with adverse circumstances, either through low population density or low income, a business case can be made that allows the deployment of broadband services. The societal good that comes from broadband in the form of access to online learning for students, job resources for adults and an overall increase in computer skills will create greater long-term benefits than long-term costs.
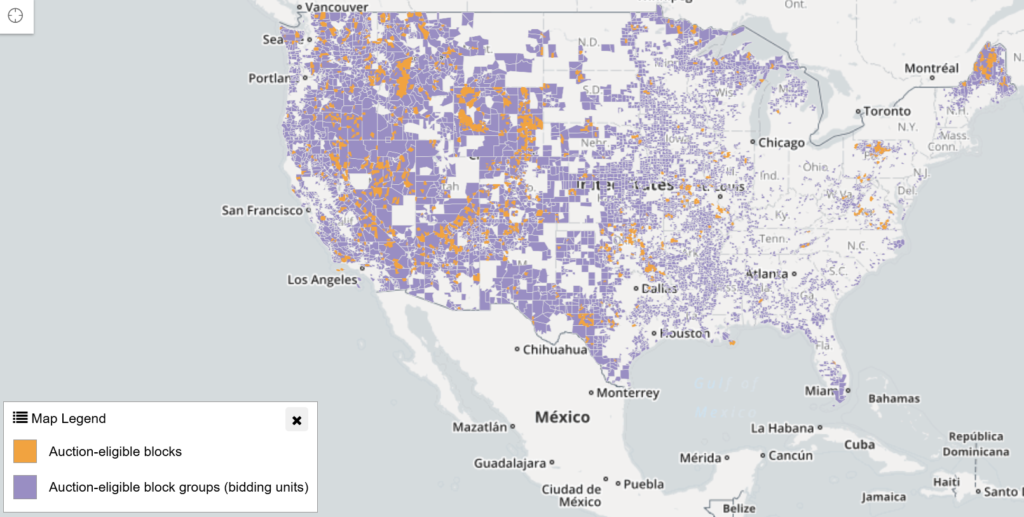
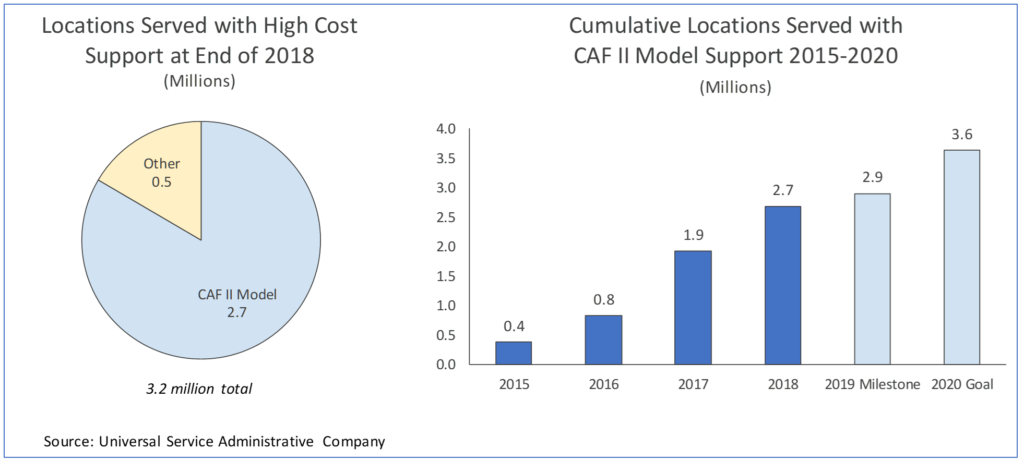
On the government side of the equation, the FCC has been very focused on allocating monies (and spectrum) for broadband. The FCC’s Connect America Fund (CAF) was born out of the National Broadband Plan from 2010 aiming to broaden the availability of broadband. Now in its second iteration, CAF II, the fund is a reverse auction subsidy for broadband providers, satellite companies and electric cooperatives to provide coverage in underserved areas.
At the end of the CAF II auction, $1.49 billion of subsidies over ten years were awarded to provide broadband and voice services to 700,000 locations in 45 states highlighted in the map above. Prospective providers successively bid on who would cover the underserved market for less and less subsidy. This ensures that the area is covered for the least cost to taxpayers.
The CAF II and other government programs are increasingly closing the gap more than $20.4 billion over the next 10 years. The US Department of Agriculture has been one of the longest standing sources of support to bring broadband to rural America with $600 million per year from the ReConnect program. In October 2020, the FCC will launch the auction for the Rural Development Opportunity Fund (RDOF), a 10-year $20.4 billion program to bring broadband to areas that do not have broadband defined at 25 Mbit/ss download speed and 3 Mbit/s upload speed.
The biggest controversy around CAF II is the mapping issues. In a nutshell, if only one location in a census track has access to broadband, it is assumed that all locations have broadband. This is in a significant number of cases is not true and some locations have access when others do not. This is especially true in urban areas where we still have some high population pockets that lack access to broadband. Parts of the FCC Commission wanted to delay additional projects until the mapping problem was solved, whereas the majority voted to release the fund and work at the problem concurrently as the underserved markets are underserved even with a tighter requirement. While being criticized for its complexity and lack of clarity of how overachievement of the target goals gets recognized and impacts winning the subsidy, the program has been overall lauded a success.
When we look at what has worked and what hasn’t worked, it becomes apparent that the for-profit system has worked for 90% of Americans to have access to at least one broadband provider. The problem becomes the hard to reach, both in urban and rural environments. No matter how we look at the issue, it becomes clear that government and cooperatives plays a role to alleviate the problem as we need to fix a societal problem.
Since Silicon Valley giants like Google with almost infinite resources have balked at building out fiber in many urban areas and are relying on cooperatives or municipalities to foot the bill, the economics of building out hard to reach parts of the United States are even more difficult.
The broadband industry is investing between $70 billion and $80 billion per year to connect Americans, the wireless industry investing another $25 to $30 billion just shows that the industry can’t shoulder it alone.
Electric cooperatives as non-profits have a longer time horizon, which makes their investment in underserved rural areas easier, as they have an already established customer relationship with the prospective customers and an established connection to the location.
The CAF and other funds have worked by providing the minimal subsidy to cover underserved markets, but we just need more. Even though some have complained that it provides for only one choice ignoring that 85% of households have a choice of two wireline providers and 99% of Americans can chose between at least three mobile service providers. The counter argument for very rural parts of the United States is that one choice in an economically unprofitable market is better than no choice. Also, one has to consider that requiring every location to have two choices roughly doubles the cost of deployment and half of the infrastructure being idle.
The program will work even better with more accurate mapping of underserved areas and through that broaden its scope from mainly rural to also urban areas and become location agnostic. If a follow-up program not only wants to bring access but also competition to an underserved area, the government would have to not only double but probably quadruple if not quintuple the subsidy due to the doubling the cost of deployment while halving the expected revenue.
The consequences of not building out areas that do not have broadband access today – regardless if urban or rural – perpetuates the current trends where we have parts of society that cannot participate in the economic and social life of our country. As 2020 has shown us, broadband internet has become the lifeline of businesses and video conferencing has become a necessity for employees to work remotely. This means that many better paid jobs are closed to people depending on where they live regardless if it is an area without broadband in the urban or rural place. Unsolved this will force a further depopulation of rural America, a flight from unserved urban areas as critical employees and business owners are effectively prevented from earning a living there. At least as important is the equal access to education. Student homework and tests cannot be counted for grading unless every student in the class is able to participate. Without broadband access, not only children who live in these unserved areas are affected but also their classmates who have access.
For a country that is known for being as efficient, organized, and technologically advanced as Germany, its state of mobile networks constitutes a rare black mark. Germany is the third largest economy in the world with 82 million inhabitants (double that of California in half of the area) with a highly efficient and advanced high-tech manufacturing industry. Where it is struggling is with the digitalization of the economy and both fixed and wireless networks. Germany’s wireless networks are ranked 32nd out of 34 countries, ahead only of Ireland and Belarus. Yet no other European country has a larger share of 3G users than Germany, and it is not uncommon to fall back to EDGE networks both in urban and rural areas. The reasons for this atypical performance lie with the actions of regulators and companies alike.
In 2010, Germany auctioned 4G licenses with the requirement that within 5 years 97% of the population would be covered by 4G. However, even by 2020, every operator has failed to meet the 2015 buildout requirement. How could this happen in a country that prides itself on following the rules?
With every new generation, German mobile operators suffer from low technology adoption because they use the same playbook over and over again (3G, 4G and now 5G), resulting in the same poor outcome. Wireless licenses in Germany and most of Europe are tied to a specific technology, whereas US licenses can be used with any technology that allows a more efficient transition from one generation to the next. Regardless, German operators rightfully realize the high value of new spectrum for next generation technology and bid more money per capita for next generational licenses than anywhere else in Europe. As a result of the significant investment in licenses, German operators position the next generation product as a premium product with a significant price premium. For this reason, consumers and businesses are reluctant to adopt next generation service plans and devices, leading to suppressed next generation revenues and profits. These low profits are then used as a justification limit capital investment in next generation technologies. Consequently, German wireless networks cover less area than they can and should. This self-fulfilling prophesy is now in its third iteration. We have seen it in 3G, 4G, and now 5G in Germany.
US carriers start from the same point of recognizing the value of next generation technology and spectrum, and US spectrum auctions have yielded the highest values globally. Unlike Germany, US mobile operators make the new technology available for the same price point as the last generation technology, creating greater profitability through a significantly lower cost structure given that next generation technology typically lowers the cost per gigabyte by 90% over the previous generation. As a result, US mobile operators see a rapid shift from the old generation to the next generation network usage as customers upgrade their devices to be able to take advantage of the new networks. By holding the price points steady for next generation networks with their faster speeds, US operators are under less price pressure than European operators, allowing operators to invest heavily in their networks and differentiate on coverage. As a result, the US ranks fifth in the world for 4G availability, behind South Korea, Japan, Norway and Hong Kong, which make up a combined 9.3% of the areas of the United States. As a result, everyone wins in the US approach: customers have faster access to next generation technology, and operators make a higher profit.
Germany’s cost problem is compounded by a legal and regulatory regime that does not favor the building of cell sites similar to Section 332 of the Telecom Act. German building permits are notoriously lengthy endeavors that take a long time. Frequent lawsuits against many cell sites lead to drawn-out legal reviews which slows down network buildout. All of these policies are not friendly for capital investment in wireless networks.
The problem of how to cover thinly populated rural areas in Germany persists. Mobile operators complain that it is unprofitable to cover many rural areas. During the 2018 Mobilfunkgipfel (Mobile Summit) between the German government and mobile operators, the government committed to share part of the cost of covering rural parts of Germany.
Coverage issues in rural parts of a country are not unique. Germany’s neighbor France – roughly the size of Texas – has tackled the issue in three different ways. For the 2G rollout mobile operators, the central government, and the departments (provinces) with coverage gaps in the rural parts of France split the cost three ways between the parties. In 2015, the French government set aside $1 billion to close the 3G coverage gaps. In 2018, the French government came to an agreement with the four incumbent operators to extend the license term in exchange for closing coverage gaps and to install jointly more than 5,000 masts and antennas.
There are four key lessons that we can take away from the German and French examples:
The business model matters. American operators are providing world class service, especially considering the size of the country. The US operator model of capturing profit through cost reduction rather than price increases is the superior model. It results in faster and higher adoption of next generation technology and greater capital investment. The one US carrier who tried to charge a premium for 5G, Verizon, has two European executives at the helm. Customer pressure quickly forced Verizon to abandon its European model of a price premium and revert back to the US model.
A mobile-friendly regulatory regime that enables the rapid building of new cell sites makes a positive difference. It is a no-brainer that when it is difficult for operators build new sites, coverage suffers.
Even medium-size economically prosperous countries like France and Germany have similar problems to economically build out mobile networks. While it is more cost effective to build out rural areas with wireless rather than fixed technology, the business case is far from a foregone conclusion.
The comparison between the US and more tightly regulated countries shows that incentives and support for wireless networks without red tape and strings attached are creating better results.
Stay-at-home orders, school closings, and social distancing have raised the issue of the digital divide in the United States. While the availability and affordability of connectivity is important, owning a device to access the internet is equally important. Broadband without a device is even less useful than a device without a network. A government program that tries to close to digital divide needs to pay attention to where a digital device gap does and does not exist.
Nielsen just published its Total Audience Report 2020 which also provides insights on device ownership by race. This allows us to glean important insights from the data and how it should inform policy makers, as there are similarities and significant differences when it comes to device ownership.
The most owned device in the United States is the smartphone. Ninety-three percent of all Americans own one. Contrary to common stereotypes, there is no significant difference when it comes to smartphone ownership – mobile is colorblind. White Americans are actually the laggards with 93% ownership when it comes to smartphone ownership as Blacks (95%), Hispanics (97%) and Asians (97%) are all reporting higher smartphone ownership. The high ownership is driven by the significant utility of smartphones – the Swiss Army Knives of the connected world. It fits in your pocket, allows people to talk, text and use the internet, and is readily financed through mobile operators or device manufacturers, bringing down the cost of the device to a manageable monthly installment.
Where we are seeing substantial differences is in computer and tablet ownership. As of March 2020, an average of 78% of Americans owned a computer. Eighty-nine percent of Asian Americans own a computer, followed by 80% of whites, but only 68% of Blacks. Similarly, 63% of Americans own a tablet. Again, Asian Americans have the highest device ownership with 72%, followed by white Americans with 64%, but only 55% of Black Americans own a tablet. Tablet and Computers are essential to closing the homework gap and, even more importantly, the testing gap. Unless every child and student has access and is able to participate in online learning and testing, the progress and grades for every child in the class cannot be counted in their official school record. This makes universal access critical for all, regardless of income and access. We need to make the ownership of computers and tablets as color blind as the ownership of smartphones.
While smartphone ownership has increased from March 2019 to March 2020, computer and tablet ownership has declined, together with ownership of other, increasingly obsolete technology hardware like Blue-Ray DVD Players, DVRs, and game consoles.
Blue-Ray DVD players and VCRs have been supplanted by video-on-demand services, which have seen a significant increase in adoption. Game consoles have also suffered from the shift to mobile gaming on smartphones and the lack of the introduction of new consoles. Both the Microsoft Xbox and the Sony Playstation 4 are seven years old and technologically obsolete, with both devices receiving a next-generation model at the end of 2020. Computers, including laptops, as well as tablets have also been struggling as they have been lacking the sorts of new features that have consumers chomping at their bits to buy a new one.
Any stimulus plan that is genuinely interested in closing the digital divide and the resulting homework and testing gaps needs to address the device gap as well. Broadband networks without the right devices are like one-handed clapping. To improve learning and to raise and broaden the standard of digital economy skills, every student should have a device that can access broadband networks. If a student’s family cannot afford such a device, the government should provide aid to acquire one. If the government is serious in bringing the high-tech device supply chain back to the United States, it can require that the devices are being manufactured in the United States and have a proportion of the component come from the United States as well so that the stimulus money actually stimulates the US economy.
The proliferation of 5G launches offers a significant opportunity for the government to stimulate innovation akin to President Franklin D. Roosevelt’s Arsenal of Freedom initiative or the space program’s myriad of spin-off innovations that have made our lives better.
5G-capable devices should be at the core of such a program with both x86 and ARM processors. American companies like Intel, AMD, and Qualcomm would provide the technology that is at the heart of these devices – the processor – and sell them to any device manufacturer. Apple would build ARM processors for its own devices. Such a device stimulus plan could be the important accelerant for ARM processors in computers and laptops. ARM processors are at the heart of smartphone and tablets as ARM processors are very energy and heat efficient, but they only slowly make an entry into the computer world as their compute power is approaching and in some cases overtaking x86 processors. Qualcomm together with Microsoft has launched an ARM laptop and Apple is rumored to use its A-series processors in upcoming MacBooks. China’s Huawei has designed its entire AI, called Ascend, and a general computer program called Kunpeng on ARM technology and plans to build an entire ecosphere around it with a $1.5 billion investment over the next five years. The United States should at least be able to match a similar kind of investment to make sure it does not fall behind if there is a significant shift to ARM computing.
With the country on the brink of a slow and painful recovery from the pandemic, the time is now for Congress to direct money where it will have the biggest economic and societal impact. Right now, closing the digital divide and the homework gaps is precisely such an opportunity. Enabling more Americans to afford an Internet-capable device is critical to the country’s recovery, and one of the fastest ways to give a voice to more black and brown Americans who are otherwise being left out of the country’s economic and other successes.
A few weeks ago, EU Commissioner Thierry Breton made headlines when he asked Netflix, Google’s YouTube and Disney to voluntarily reduce their video quality from High Definition to Standard Definition in order to “secure Internet access for all.” Is this an EU bureaucrat detached from reality gone wild or is there something more behind it? What most headlines did not report is that Thierry Breton is the former CEO of France Telecom now Orange, the 10th largest telecommunications provider in the world. By moving from HD to SD the data speeds needed to support streaming video declines by 80% from roughly 5 Mbit/s to 1 Mbit/s. To quote the eternal wisdom of Depeche Mode: Everything counts in large amounts. Especially when you multiply the reduction by 200 million households. If at the peak hour, half of the EU, roughly 100 million households, are watching streaming video and all of them are using SD instead of HD, then peak edge network load goes down by 400 million Mbit/sec or 400 TBit/second.
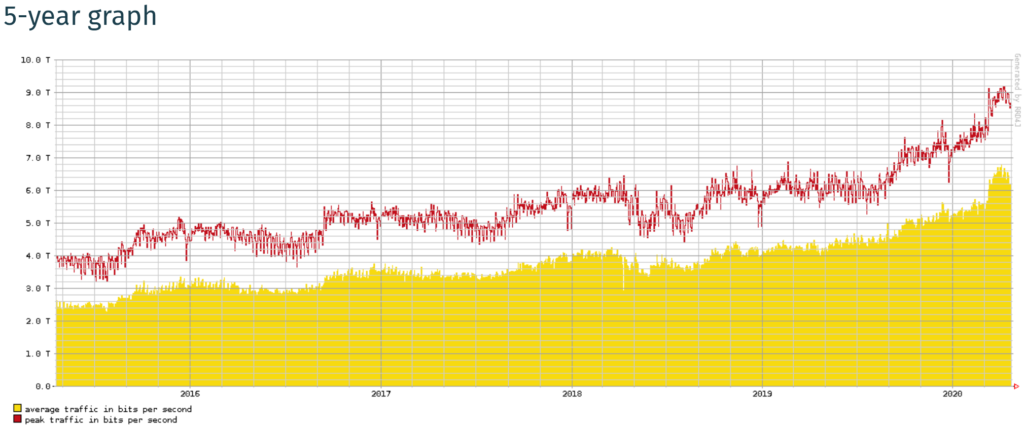
Europe’s largest internet exchange, DE-CIX is publishing its usage and performance data in real time for all its internet exchange points. Below is the 5-year traffic graph for Frankfurt from April 21, 2020s, the world’s largest internet exchange point:
On one hand, the impact of the Covid-19 quarantine is quite visible at the right. Peak usage went up by 50% from around 5.8 Tbit/s to 9.1 Tbit/s which is quite an increase that could cause alarm until you know that peak capacity is 58.4 Tbit/s. The concerns of Commissioner Breton cannot be in regard to the core internet backbone being in danger of potential breakdown. It has to be the edge network, since the core network is holding up well.
We know from the experience in the United States that the fiber and cable networks providing tens up to 1000 Mbit/s speeds are holding up well as traffic has increased. The problem arises at DSL networks, a technology that allows several Mbit/s data connections over copper wires, that often can only support 15 Mbit/s or less over short distances from a central office. Next generation VDSL can provide up to 200 Mbit/s over distances of less than 200 yards from a central office. The problem is that central offices are generally further apart than 200 yards and speeds fall off dramatically.
American telecommunications providers have invested heavily in moving beyond DSL and continue to invest heavily to expand their broadband offers. Congress and the Federal Communications Commission have dedicated billions more to improve access for every American at every point in the network, from last mile to the radio access network. This has not been the case in Europe.
A good proxy of how fast and developed a country’s broadband infrastructure is how much money the carriers have invested in the technologies and networks on a cumulative basis.
The OCED identified $944 billion was invested the EU telecommunications networks from 2002 to 2018 improving the connectivity of the EU’s 527 million citizens. Over the same time period, the OECD reports that the US invested $1.323 trillion in US telecom networks, covering 320 million Americans. Of these 320 million, 90% have access to fixed broadband internet service. From 2002 to 2018, the US accounted for 42% of global telecom investment among all 37 OECD states.
Source: OECD and UN Population Estimates, 2020 (https://www.oecd.org/sti/broadband/9b.Investment.xls)
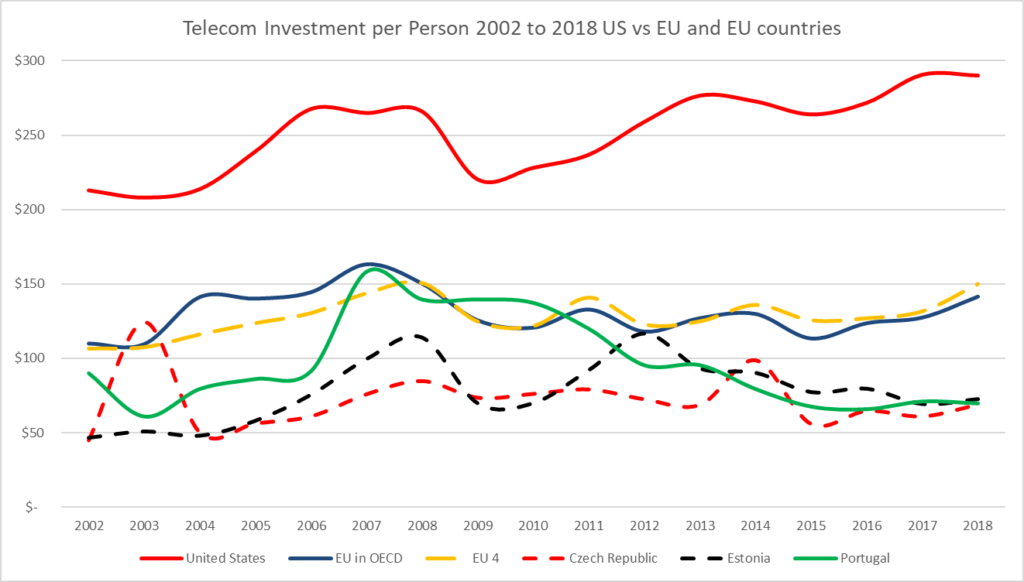
When looking at the telecom investment per person in the US and EUR, the difference between the investment per person is stark.
Consistently, more than $200 per person is invested to connect people in the United States. In 2017 and 2018, the two most recent years available, American telecom companies have invested $291 and $290 per person, respectively. The average for the EU4 (Germany, France, Italy and Spain) was $150, about half of what is spent in the U.S. The spend in countries other than the big four has been even less.
In the Czech Republic, only $69 per person is invested in telecommunication infrastructure, in Estonia $70 and Portugal $73. Thus, Commissioner Breton called Netflix, Google, and Disney to ask them to throttle their traffic to ensure the maximum number of EU citizens could have access to the Internet; however, due to the US’ spectrum policy, efforts to speed deployment of mobile and fixed infrastructure and a more evolved, and light touch regulatory framework has produced a far superior broadband infrastructure in the US than compared to EU.
The FCC is on a rampage trying to make as much spectrum
available for 5G as it can. But in so doing, is it creating an imbalance in
spectrum allocations in the U.S., and if so, what will that mean for the mobile
industry in the U.S. At the same time, cable companies are renewing their
efforts around spectrum usage and ownership understanding that their future
involves both licensed and unlicensed wireless. In various ex parte’s by cable
companies they eloquently show the need and benefits of unlicensed spectrum,
especially for WiFi 6 and the upcoming WiFi 7 standards. In addition, the cable
companies state that they are likely bidders in the upcoming CBRS auction.
Licensed CBRS would not only help cable companies with their wireless efforts
to potentially off-load MVNO traffic but also expand their footprint to
households that are currently not served by cable.
This spring, the agency is widely expected to approve the allocation
of 1,200 MHz of spectrum in the 6 GHz band (5.925 to 7.125 GHz) for unlicensed
use. Although the FCC proceeding assessing what to do with this spectrum has
been ongoing since 2017, media attention has only recently been focused on the
issues. The FCC’s expected decision would depart from the agency’s typically Solomonic
spectrum allocation process where critical spectrum resources are provided for
both licensed and unlicensed use.
As pointed out in a recent OpenSignal report,
the US spectrum position is less than ideal. Due to the lack of mid band
spectrum, US carriers have to provide a mixture of high speed 5G with very
limited range or slow 5G with significant coverage. Only Sprint, as the single American
carrier with a deep 2.5 GHz mid band spectrum portfolio, can provide both good
coverage and higher speeds, and leads in the combined 4G/5G download speed
tests.
5G done right requires low band for coverage, mid band for
general capacity and speed and high band for hot spot ultra-high speed and
capacity. We have low band spectrum, the FCC is doing a world-leading job in
clearing high band spectrum, but we are falling short on mid band. The brewing
controversy around making the entire 6GHz allocation unlicensed seems to be a real
one because this spectrum could be the answer to the licensed operators’ need
for mid-band spectrum. Specifically, licensed
use of 6 GHz could give the network
operators spectrum to close the gap between the 350 Mhz licensed spectrum for
5G (280 MHz allocated in the C-Band plus the 70 Mhz licensed part of the 150
Mhz CBRS spectrum), and what other countries have allocated or are already using
for mid-band 5G. For example, South Korea’s 5G networks run on 280 MHz of
mid-band spectrum and will gain another 320 MHz for a total of 600 MHz. Japan’s
5G networks rely on 800 MHz with another 200 MHz for a total of 1,000 MHz and
China has 460 MHz allocated to 5G as it is.
Curiously no one seems to be jumping up and down on Capitol
Hill asking about the foregone billions of dollars in auction proceeds that
would normally go to Treasury if the spectrum were auctioned. An especially odd fact given the economic
uncertainty around the impact of the Covid-19 virus.
There seems to be widespread agreement across the tech and
mobile industries that the United States leads the world with innovations
evolving out of unlicensed spectrum, including WiFi 6 and WiFi 7. 5G and WiFi are important complements. Thus,
it’s curious why the FCC seems so disinclined to figure out a way to divvy up
the 1200 MHz of 6 GHz for both licensed and unlicensed used. WiFi 6 is using
160 MHz channels aimed at high bandwidth, low latency applications such as AR
and VR, with WiFi 7 doubling the channel size to 320 MHz for double the speed.
The 6 GHz band lends itself to a high reuse pattern due to the medium range of
outdoor usage combined with the difficulty of the radio waves at 6 GHz to go
through walls.
In order not to fall behind other countries who are vying
for technological leadership and become the country or region where new
inventions are created and rapidly monetized, the United States must bring its
spectrum allocations up to par. The United States through its lead in 4G LTE
was able to benefit greatly from the smartphone boom and the app economy. We had the right spectrum when we needed it.
Other countries with less flexible spectrum availability fell behind and until
now, were not able to catch up. Without our leadership in 4G LTE, companies
like Google, Facebook, and Apple would not have become the globally successful
companies that have driven the US stock market to unprecedented heights. Without
our global leadership in WiFi, fixed wireless devices in the home would be
unthinkable. For example, roughly 70% of Americans are using their mobile
device, using both licensed and unlicensed spectrum, when they are watching
content on their TV. A company like
Qualcomm is similarly successful in both 4G LTE, 5G and WiFi, having developed
the necessary underlying technology and chip sets that makes all of mobile
communications work.
The most effective US spectrum policy has been to supportsboth
licensed and unlicensed allocations. Departing from that now, at a critical stage
in 5G development and deployment, seems alarming and brings into question the
ability of US companies to maintain their global leads in innovation, mobile
standards setting and more.
If you missed our analyst call on Wednesday with Roger Entner, Peter Rysavy and Avi Greengart you can listen in now! Topics discussed included 5G network deployment, the future of smartphones in a 5G world, cloud computing, use cases for artificial intelligence, and more!
What to Listen For:
“Even though the opportunity to connect to 5G today is limited – it’s amazing that we can connect to 5G at all. Because when we started working on the standards we weren’t expecting any deployment until 2020. So we’re actually a year ahead of schedule which is remarkable for the complexity.” – Peter Rysavy, Rysavy Research
On the benefit of advancements in AI and AR technology: “If you’re trying to wire up an airplane, having a heads up display where it can show you how to wire up the airplane in real time, with overlays of what you’re seeing and what you should be seeing…the return on investment is crazy high. It’s so high in fact, that in that particular use case, Boeing and Airbus are willing to develop these systems in-house, building their own custom software, in some cases building their own custom hardware.” – Avi Greengart, Techsponential
“Another topic that’s going to be really interesting is the whole convergence issue of telecommunications with content…70% of wireless usage is video, and so video becomes more and more important and some of the more obscure things that nobody paid attention to will become much more prevalent. For example, the STELAR re-authorization.” – Roger Entner, Recon Analytics
Have Questions? Head to Twitter and Chat With Us:
Host Roger Entner: @RogerEntner
Peter Rysavy: @peter_rysavy
Avi Greengart: @greengart