The Super Bowl is not only the pinnacle of the American Football season, but it is also the show case event for wireless carrier. Every year, every wireless carrier sets aside tens of millions of dollars to improve the wireless network for the big game. The newest and best gets installed so that attendees and regular citizens alike get a superior experience. One of the challenges that mobile operators have to overcome in order to provide faster speeds is how to best use the spectrum they have. The spectrum portfolio of each carrier has different amounts of spectrum ranging from 600 MHz and 700 MHz all the way to 39 GHz. In order increase the speed for customers, the spectrum slivers can be bonded together in a process called carrier aggregation (CA). The maximum amount of spectrum that LTE can have in a channel is 20 MHz and 5G is 100 MHz. So even if a mobile network operator has 1,200 MHz of contiguous spectrum with 5G they could aggregate 12 100 MHz channel for the maximum amount of bandwith which directly translates into speed.

Global Wireless Solutions (GWS) conducted network testing during the 2021 Super Bowl in Tampa and provided some additional insights that typically don’t get mentioned with other tests. GWS found that AT&T used 8 channel CA using 800 MHz of its 39 MHz spectrum, Verizon used 6 CA using 600 MHz in 28 GHz, and T-Mobile 4 CA using 400 MHz in 39 GHz plus 80 MHz in the 2.5 GHz band. The availability using the 28 and 39 GHz band was almost the same for every carrier at 73% to 77%, which isn’t surprising considering the relatively small area covered. T-Mobile’s 2.5 GHz coverage added another 20% of coverage. Considering more spectrum means more speed, it comes as no surprise that AT&T was the fastest with peak speeds of 1.7 Gbps, Verizon with 1.5 Gbps and T-Mobile with 1.1 Gbps.

The GWS tests show that it is not only important to have a lot of spectrum. It is even more important to use it. Not only does the network have to be ready for it, but also the device. Most flagship devices are using the Qualcomm Snapdragon X55 modem. Devices using this modem, like the Samsung Note 20 that the GWS engineers used for the tests can utilize 8 channel CA in the mmWave band (> 6 GHz) with 2×2 MIMO and 200 MHz 4×4 MIMO below 6 GHz with 7×20 MHz channel CA for LTE. This means that when T-Mobile uses all its on average 130 MHz 2.5 GHz spectrum, current flagship devices will be ready. When Verizon and T-Mobile are ready to follow AT&T’s lead with 8 channel CA, the devices will also be able to support that. The Qualcomm X60 modem that’s for example in the Samsung Galaxy S20  can aggregate spectrum below and above 6 GHz. This allows to combine the better coverage characteristics of sub-6 GHz spectrum with the massive spectrum bands and therefore speeds that are available above 6 GHz. The X60 modem also works with the upcoming C-Band networks that will probably become available in 2022.

A few weeks ago, EU Commissioner Thierry Breton made headlines when he asked Netflix, Google’s YouTube and Disney to voluntarily reduce their video quality from High Definition to Standard Definition in order to “secure Internet access for all.” Is this an EU bureaucrat detached from reality gone wild or is there something more behind it? What most headlines did not report is that Thierry Breton is the former CEO of France Telecom now Orange, the 10th largest telecommunications provider in the world. By moving from HD to SD the data speeds needed to support streaming video declines by 80% from roughly 5 Mbit/s to 1 Mbit/s. To quote the eternal wisdom of Depeche Mode: Everything counts in large amounts. Especially when you multiply the reduction by 200 million households. If at the peak hour, half of the EU, roughly 100 million households, are watching streaming video and all of them are using SD instead of HD, then peak edge network load goes down by 400 million Mbit/sec or 400 TBit/second.

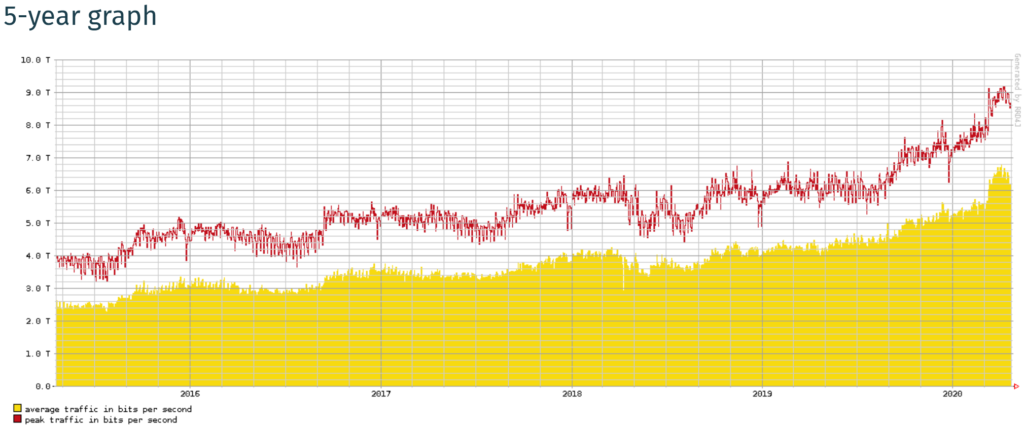
Europe’s largest internet exchange, DE-CIX is publishing its usage and performance data in real time for all its internet exchange points. Below is the 5-year traffic graph for Frankfurt from April 21, 2020s, the world’s largest internet exchange point:

On one hand, the impact of the Covid-19 quarantine is quite visible at the right. Peak usage went up by 50% from around 5.8 Tbit/s to 9.1 Tbit/s which is quite an increase that could cause alarm until you know that peak capacity is 58.4 Tbit/s. The concerns of Commissioner Breton cannot be in regard to the core internet backbone being in danger of potential breakdown. It has to be the edge network, since the core network is holding up well.

We know from the experience in the United States that the fiber and cable networks providing tens up to 1000 Mbit/s speeds are holding up well as traffic has increased. The problem arises at DSL networks, a technology that allows several Mbit/s data connections over copper wires, that often can only support 15 Mbit/s or less over short distances from a central office. Next generation VDSL can provide up to 200 Mbit/s over distances of less than 200 yards from a central office. The problem is that central offices are generally further apart than 200 yards and speeds fall off dramatically.

American telecommunications providers have invested heavily in moving beyond DSL and continue to invest heavily to expand their broadband offers. Congress and the Federal Communications Commission have dedicated billions more to improve access for every American at every point in the network, from last mile to the radio access network. This has not been the case in Europe.

A good proxy of how fast and developed a country’s broadband infrastructure is how much money the carriers have invested in the technologies and networks on a cumulative basis.

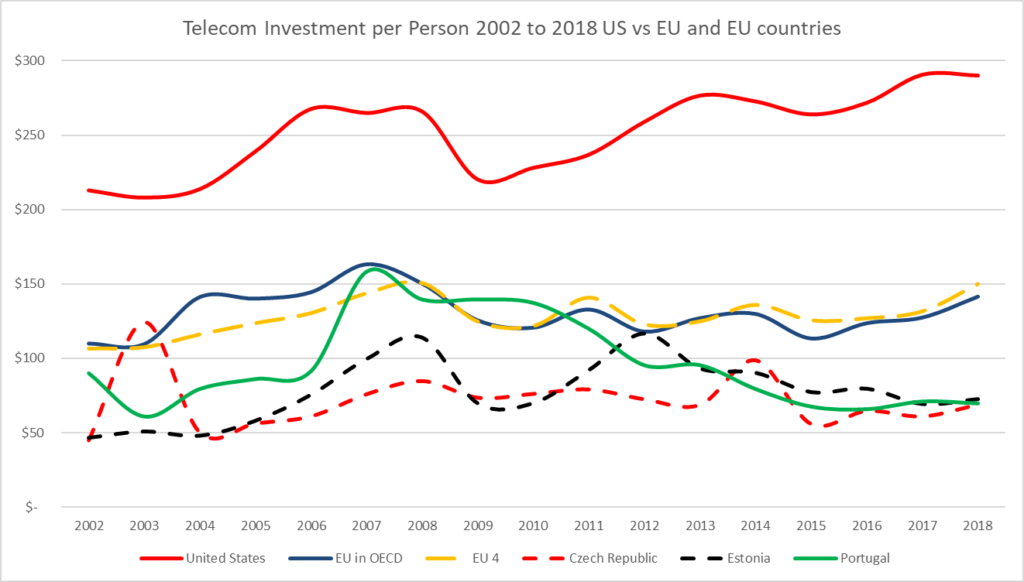
The OCED identified $944 billion was invested the EU telecommunications networks from 2002 to 2018 improving the connectivity of the EU’s 527 million citizens. Over the same time period, the OECD reports that the US invested $1.323 trillion in US telecom networks, covering 320 million Americans. Of these 320 million, 90% have access to fixed broadband internet service. From 2002 to 2018, the US accounted for 42% of global telecom investment among all 37 OECD states.

Picture 2

Source: OECD and UN Population Estimates, 2020 (https://www.oecd.org/sti/broadband/9b.Investment.xls)

When looking at the telecom investment per person in the US and EUR, the difference between the investment per person is stark.

Consistently, more than $200 per person is invested to connect people in the United States. In 2017 and 2018, the two most recent years available, American telecom companies have invested $291 and $290 per person, respectively. The average for the EU4 (Germany, France, Italy and Spain) was $150, about half of what is spent in the U.S. The spend in countries other than the big four has been even less.

In the Czech Republic, only $69 per person is invested in telecommunication infrastructure, in Estonia $70 and Portugal $73. Thus, Commissioner Breton called Netflix, Google, and Disney to ask them to throttle their traffic to ensure the maximum number of EU citizens could have access to the Internet; however, due to the US’ spectrum policy, efforts to speed deployment of mobile and fixed infrastructure and a more evolved, and light touch regulatory framework has produced a far superior broadband infrastructure in the US than compared to EU.

At the end of October, Recon Analytics surveyed more than a thousand American consumers to assess their awareness of and attitudes towards the variety of ways internet companies and social media platforms like Facebook, LinkedIn, Snapchat and Twitter collect, track and use consumers’ personal information.  The survey, explained below, reveals that a majority of Americans are concerned about the amount of personal data these companies track and strongly favor more transparency on how personal data is collected and used as part of internet companies’ business models.

Key findings: 

  • An overwhelming majority of consumers, 73%, are concerned about how their personal data is being collected and used by internet companies.
  • Almost 77% would like more transparency on the ads being targeted to them based on the personal data the internet companies collect.
  • Among those surveyed there is a shared feeling of uncertainty and insecurity over how much internet companies and platforms know about each of us and what they’re doing with that information.
  • More than 70% of respondents are unaware of tools they can use to control or limit the usage of their personal data.
  • Nearly one third of respondents, 29%, did not know that many of the “free” online services they use are paid for via targeted advertising made possible by the tracking and collecting of their personal data.
  • Almost half of the respondents are aware that Facebook and Google track their personal data even when they are not actively using their services.
  • A vast majority of those surveyed, 77%, support regulations that would require Google, Facebook and other online platforms to be more transparent about how and what personal data they collect from consumers.
  • An even greater majority, 82%, are in favor of legally requiring internet companies to disclose what information they collect and to whom they sell it to.
  • More than half of the respondents, 55%, would use internet companies’ products and services more if they would give consumers greater control over their personal information.

The all-encompassing surveillance and storage of personal data by internet companies with limited or no regulatory or legal checks and balances worries most Americans, rightfully so, especially when the attitudes of many of these companies’ senior leaders are taken into account.

Nothing to hide

On December 3, 2009, Eric Schmidt, then-Google CEO and current Executive Chairman of Alphabet Inc., Google’s parent company, dismissed the notion of online privacy in an interview with CNBC, saying, “If you have something that you don’t want anyone to know, maybe you shouldn’t be doing it in the first place.”

Terrifying as that statement may be, Google’s all-seeing eye may have already made secrets a thing of the past.

At the 2010 Washington Ideas Forum Schmidt offered more insight into what Google knows.

“We don’t need you to type at all. We know where you are. We know where you’ve been. We can more or less know what you’re thinking about,” he told attendees.

Social norms

Facebook’s chief executive Mark Zuckerberg has a similarly cavalier attitude when it comes to online privacy. In 2010 he said the conventional concept of privacy is no longer a “social norm.” Later that year a Facebook employee claimed that his boss simply “doesn’t believe in it.” Perhaps unsurprising given that Zuckerberg described those who trusted him with their data as “dumb [expletive]s” shortly after launching the social media platform.

Transparency

Efforts from internet companies’ to be more transparent about how they use consumers’ personal data may be too little, too late: one third of respondents said increased transparency will not alleviate their concerns about online data collection and usage.

Regulation on the horizon?

Americans are skeptical about government interference in private businesses and for the past two decades the internet grew and evolved with little regulatory oversight. The Federal Communications Commission (FCC) took a largely “hands off” approach to regulating the internet under both Democrat and Republican administrations. As a result, the internet economy grew by leaps and bounds. The resulting bonanza has been so successful that today four of the world’s largest corporations are unregulated technology firms: Apple, Alphabet Inc., Microsoft and Amazon. Their founders have become some of the wealthiest people on the planet.

Although the “hands off” approach has long been favored by regulators, the pendulum is now heading in the opposite direction. This is quite a reversal of fortune for internet companies who – just two years ago – were successful in persuading the FCC to impose privacy regulations on network providers to thwart a competitive threat to their business models. Earlier this year internet companies deployed their lobbying muscle to fight Congressional proposals that would have extended the privacy rules beyond network providers to companies like Google and Facebook. What’s good for the goose apparently isn’t good for the gander.

Long term outlook

The silver lining for internet companies and their investors? Over half of Americans – 55% – would use their products and services more if they would give consumers greater control over their personal information. This would require a radical change in thinking by these companies in that they have to depart from the mindset that they own the consumer data they collect. They might have a license to use it, the same way that consumers have a license to use a search engine or a software product, but fundamentally it is an equal exchange.

Although Americans have cheered the free services offered by companies that previously have had “Don’t Be Evil” as their motto, a certain sobering feeling is taking over. Today, internet companies maintain the upper hand in the online economy: they own their products and services and the data and information generated by their customers. This paradigm won’t last forever so these “disruptors” must prepare for when regulators come to disrupt them.

It’s the time of year again. No, not holiday season. It’s the season where wireless network testing results are being released and companies use the often conflicting data to jockey for media and customer attention. To better navigate the basis of these claims, we’ve put together a primer regarding network testing comparing the strengths and weaknesses of the three key platforms: drive testing, crowd testing, and surveys.
Drive testing

Drive testing is done by a fleet of cars and small trucks that have multiple network providers on board. The vehicles then drive for potentially thousands of miles in a given city and its surrounding area, making non-stop calls and data connections measuring which network – 3G, 4G LTE etc. – it can access and how reliable and fast the connection is, for each provider. For voice, it measures if the call goes through, is dropped, and the voice quality of the connection. For data, it measures if the connection is possible and is maintained, and the speed and latency of the connection.

Contrary to what you might assume, not all devices connect equally well to a network. To account for this, the drive tests are usually done with the same device or as similar as possible for all networks tested. Most of the time, Android devices are used, as Android allows much greater access to the underlying mechanics of the connection than iOS devices.

While among the most scientific of approaches, the weakness of some drive testing results is that every year the metrics are recalibrated. When done right this does not distort the rankings, but makes it extremely difficult to accurately track the progress the various carriers have made year after year.
Crowd sourced data

Crowd sourcing data is gathered via an app that consumers download to their device. The tests are done by users whenever they choose, on any device – whether old, new, perfectly working or slightly damaged. If a customer has a defective device and over and over runs a crowd test application to verify his or her experience of having a slow connection, is it the network or the device that is to blame?

People usually perform such a test when they want to show off how fast their connection is, or to find out why the connection is slow. This often leads to the extremes being recorded, rather than giving a true sense of the average connection. Additionally, because of the nature of crowd sourced data there is an over-representation of certain demographics. For example, urban areas with younger consumers tend to witness more tests, meaning wireless networks that are less built out in rural areas can be favored in the results.

An advantage of this approach is that it is an ongoing measure. Customers are doing these tests every day, whereas due to the significant effort involved with drive testing or surveys, those tests are done monthly, semi-annually or even annually.

Crowd-sourced data’s strength comes from the fact it is sourced from real users in real-life situations, often via millions of tests – but that is also its central issue. Such tests are not repeatable or verifiable and anomalies in the data shake my faith in them. For example, a crowd-sourced provider a few years ago broke out their results for a big brand carrier and its two sub-brands. While all were running on exactly the same network, the crowd sourced provider presented three vastly different results. It is also uncontrolled and not immune from outside manipulation.
Customer experience studies

The third most common way to measure the performance of a network is through a survey asking consumers regarding their experience and perceptions.

The advantage of surveys over crowd sourcing is that surveys are generally created with a representative panel that represents the age, race, gender, socio-economic, and geographical distribution of the underlying population.

Though it holds this benefit over crowd sourcing, survey testing has some issues as well. Survey results can confuse the performance of a device with the performance of the network. In addition, survey testing relies on the recollection of consumers of how the network has performed, which may be imperfect as people take into account not only how the network is behaving now but also how it has behaved in the past. In addition, people’s opinions are highly subjective. What is fast and reliable to one person is not necessarily fast and reliable to someone else.
Summary

While the marketing teams behind each of the different test types can use whichever method best suits their purposes, it’s instructive to look at what network engineers use when making their decisions about network improvement. With drive testing results more indicative of actual network behavior than any other methodology, engineers rely on it as the most scientific approach. Crowd sourced and customer survey data is of course important, insightful and should not be ignored by any means. However, when it comes to truly evaluating a network’s performance, I’d look first and foremost at what the drive tests reveal.

How the three tests compare

Drive Testing Crowd Testing Survey
Consistent & Repeatable Yes No No
Controlled measurement of network Yes No No
Sample size Millions Millions to Billions Thousands
Device bias No Yes Yes
Self-selection bias No Yes Yes
Geographic & socio-economic bias No Yes Yes
Subject to manipulation No Yes No
On-going testing No Yes No
Longitudinal analysis No Yes Yes

Originally published on 8/29/17 at: https://www98.verizon.com/about/news/primer-network-testing

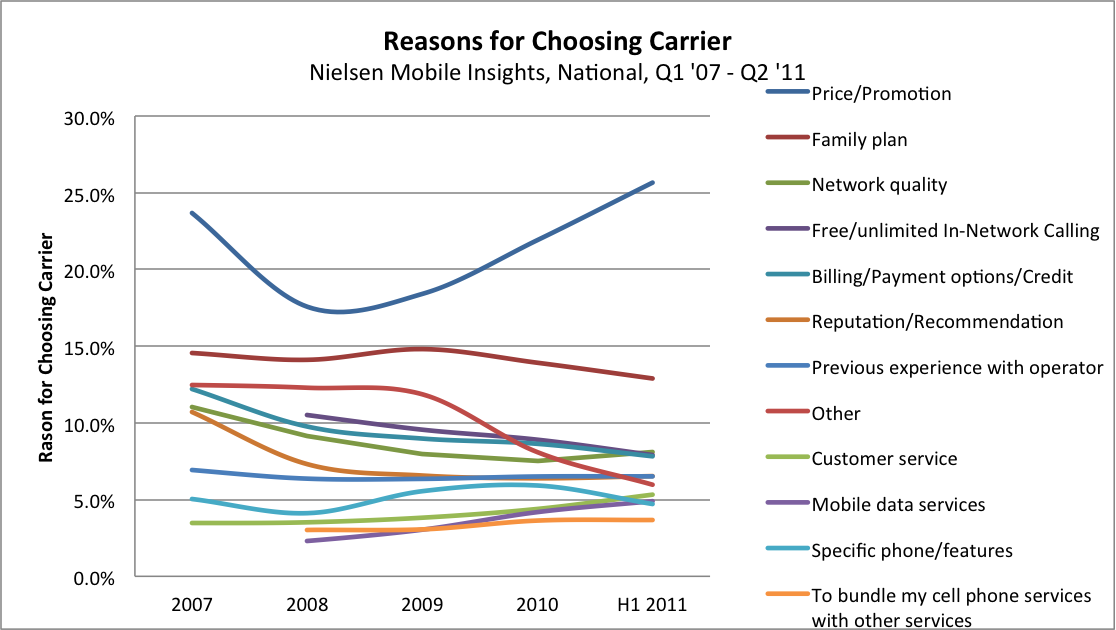
The reasons for choosing a wireless carrier changes over time but then do they really change that much? New data from Nielsen shows the trends.

With the current merger between AT&T and T-Mobile underway, the reasons why and how people pick their carrier are quite significant, and the data is certainly illuminating. The most important purchase decision factor is price, and it has become more important since the beginning of the recession. Mobile data services is the purchase decision factor that, other than price, has more than doubled in importance over the last three years.

Not surprisingly, price and promotion are the most important purchase decision factors and they have resurged since a low in 2008. Three years ago, in 2008, 17.6% of people said they picked their carrier based on price. In mid-2011, this  skyrocketed to 25.7%, due to the continued difficult financial times many Americans are experiencing. With price being the most important purchase factor, one would think that T-Mobile, which is described by many merger critics as the low cost provider in the industry, would flourish and consistently gain customers. However, T-Mobile is losing customers. How can that be? The reason is that T-Mobile is actually the most expensive low-cost carrier in the country. Providers that offer prices lower than T-Mobile – Metro PCS, Leap Wireless, and Tracfone – are growing by leaps and bounds, capitalizing on this shift back to price consciousness.

The importance of Family Plans and Free in-Network Calling has lessened over the last several years. In 2008 and 2009, the combined metric was actually more important than price to consumers with a 2009 high of 24.4% for the combined metric versus 18.4% for price. Sprint adeptly recognized both the threat and the opportunity that lay hidden in that data point. Their inability to match Verizon’s or AT&T’s free calling circles was strangling the carrier’s gross additions and they had to break free from it without destroying value by going unlimited. The Any Mobile, Any Time plans, which offer free calling to any mobile device did exactly that. It provided a better value by offering more free mobile calling at a lower price. The plan was launched in September 2009. The impact was immediately measurable with a significant uptick in gross additions. The massive impact of this plan, supported by a focused marketing message, turned around the fortunes for the Sprint-brand of the company. The relative decline of this metric may indicate the need for Sprint to adjust their go-to-market strategy.

Network quality as the most important purchase decision factor has also declined since 2007 from 11% to 8.1%. This represents a maturing of the networks in major urban areas, where the difference between the best and the worst networks – contrary to the vitriol on blogs – has actually declined. It is now a matter of “good enough” not of being perfect. This is a dangerous trend for Verizon, where network superiority has been a cornerstone of the company’s success . It’s massive 4G LTE build-out is a testament that the company still believes it can revive the network theme when making the generational shift to LTE. The industry-leading net subscriber add numbers are supporting that the investment was well spent, especially as it shifts its network superiority investment and message to wireless data.

Billing, payment choices and credit declined in importance as each carrier basically offers the same options.. The only carrier that offers something unique is AT&T with Rollover Minutes, where unused minutes can be carried over for up to one year.

Contrary to the hype we hear on the internet, that people will leave the combined AT&T and T-Mobile if the merger goes through, only 6.5% consider the reputation of the carrier as their main reason for choosing their operator, down from 6.9% in 2007. The facts just don’t support the rhetoric.  This is similar to the impending doom that would befall AT&T if Verizon acquired the iPhone. In Q2 2011, AT&T sold more iPhones than Verizon, even though Verizon grew faster than AT&T in the first full three month period when the devices were available at both carriers.

The reputation of the carrier and the recommendations of others are becoming less important to Americans as they have more and more first-hand experience with the majority of operators. The 6.5% of respondents that consider carrier reputation their most important decision criterion represents about a quarter of the people who consider price the most important reason for choosing a carrier. In 2007, 10.7% considered this the most important factor in choosing a wireless carrier. In mid-2011 it was down to 6.5%. Bundling continues to be a minor issue, with only 3.7% making it their top priority, albeit up from 3.1% in 2008.

With so many Americans having first-hand experience with various carriers, and mobile devices becoming more complex, it is no surprise that customer service is an increasingly important factor. In the first half of 2011, 5.3% of people responded that customer service was their main reason for choosing their carrier, compared to 3.5% in 2007.

About 4.7% of Americans consider a specific phone (everybody can guess that this is code for the iPhone, since it gets the juices going like nothing else) to be the main reason for choosing a wireless carrier. A sobering fact – being, in fact, the second to last important factor in choosing a provider – considering how high handset exclusivity is on the mind of many policy makers. Just as the discussion is heating up in Washington, the importance is declining compared to previous years. In the first half 2011, it has declined below the 2007 percentage.. The drop is particularly large when we compare 2010 with first half of 2011 with 5.9% compared to 4.7%. About 25% fewer people consider a given device their number one decision factor after the iPhone was available from both AT&T and Verizon. With the rumored launch of the iPhone on T-Mobile and Sprint in the fall, the number will probably decline even further.

Last, but not least, mobile data services have significantly gained in importance over the last several years. Considering that more than two-thirds of the devices sold in this country are smartphones, it is hardly surprising. In 2008, only 2.3% considered data their most important decision criterion for selecting a carrier. By the first half of 2011, this has increased to 4.9%. With America’s love affair with accessing their data and being entertained by their mobile devices, continuing to grow, this number will only go up. Considering that this fall, everyone will largely have the same device line up, the network that powers mobile data services will become ever more important. The days are over when some operators were able to skimp on their 3G data networks or could even skip it completely due to the dominance of voice. A carrier will have an extremely hard time competing if it doesn’t have a 4G network in 2012 and beyond.

A year ago in June 2010, I undertook the first endeavour to quantify the data tsunami that is challenging wireless operators. Nielsen kindly provided again the data to quantify the strength of the data tsunami.

So what has happened over the last year?

Most carriers introduced changes to their pricing plans. Tiered data pricing has gained traction, with AT&T continuing to offer full-speed tiered pricing, whereas T-Mobile USA has just introduced tiered pricing that includes throttling after the purchased amount of data has been used up. Sprint opted to maintain their unlimited plans but increased the price by $10 per month, and while Verizon was standing pat with its unlimited plan, it announced that this would change by summer – most likely with the introduction of the next generation iPhone. This means that the four nationwide operators have four different approaches to data pricing and consumers. Despite many dissonant voices on the web to the contrary, consumers do not seem to have a distinct preference for any one of them as indicated by the relatively unchanged net subscriber and churn metrics.

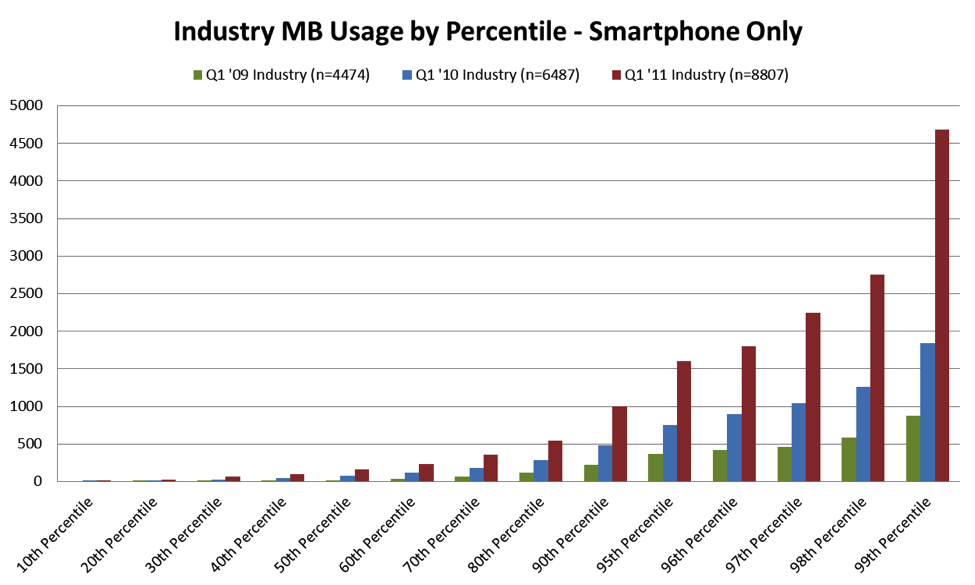
As the data in the table below shows, the demand for wireless data continues to increase dramatically.

Exhibit 1:


Source: Nielsen, Customer Value Metrics, Single Line Accounts

Not only has the ownership of smartphones dramatically increased, but usage has increased within every usage percentile by a factor of two or more. Smartphone owners at the 20th Percentile are now using 27 MB of data per month, almost three times more than the 8 MB than they used in 2010, and 479-times more than in 2009 when the 20th Percentile used only 50 KB per month. The median customer (50th Percentile) uses 160 MB in Q1 2011, up more than two-fold from 77 MB in 2010, and eight times more than in 2009 when it was 20 MB per month. We are seeing the most dramatic increases among the heaviest users. Usage at the 90th Percentile increased to almost 1 GB in 2011, up by about a factor of two compared to the 478 MB in 2010, and 4.5 times more than the 222 MB they consumed in 2009.

The distribution of total mobile data usage among smartphone owners has also changed. While the new tiered data plans have introduced more fairness to data pricing and usage because low usage customers no longer subsidize high usage customers as they did under the “one size fits all” model; they have not stymied usage or skewed take-up. The iPhone launched with Verizon Wireless in February 2011 with an unlimited plan whereas AT&T continued to offer 200MB and 2GB data packages. Per day sales, in the next 60 days was almost identical for both operators with about 40,000 each. This is even more remarkable as in Q1 2010, the top 5% of bandwidth users consumed 41.9% of all data consumed, whereas a year earlier, the top 5% of bandwidth users consumed 43.6% of bandwidth.

What the Exhibit 1 does not show is that this per-subscriber usage increase occurred simultaneous with a huge increase in smart phone ownership, which doubled compared to a year ago, leading to the overall conclusion that total data consumption quadrupled over the last 12 months. While this is a smaller percentage growth rate than in 2009, in the year 2010 the United States consumed more wireless data was than has been consumed since the beginning of this technology in 1999.

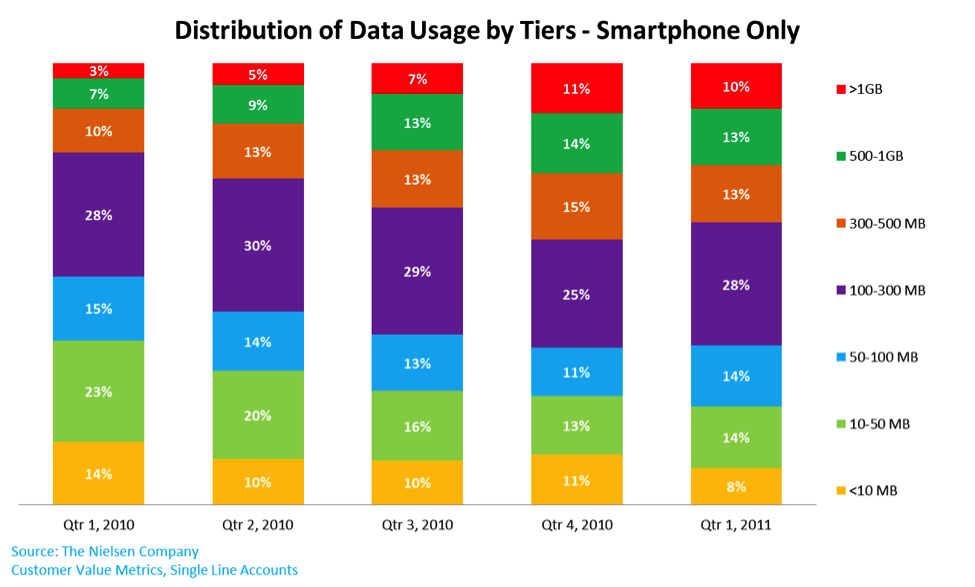
One of the most interesting factoids from last year’s research note was the fraction of smartphone owners that used only very small amounts of data. As we can see in Exhibit 2, the percentage of smartphone users that used less than 10MB per month almost halved from 14% in Q1 2010 to 8% in Q1 2011.

Exhibit 2:


At the same time, the segment using more than 500MB per month increased from 10% to 23%, while the percentage of smartphone users using less than 50MB declined from 37% to 22%. All the other usage buckets stayed basically the same over the course of the last year. This is particularly remarkable because during this time period the absolute number of smartphone owners more than doubled and we would expect low usage categories to expand as more people are becoming smartphone users. New devices with larger screens, faster processing capabilities, and new video formats optimized for smartphones have made data usage more conducive and seductive and consequently data consumption increased significantly.